|
Mission Log: July 11, 2006
Painting the Seafloor: Why and How We Map
Paulo Maurin
University of Hawai'i
Dena Deck
Bellflower Unified School District, California
In collaboration with Dr. John Rooney
NOAA Fisheries Coral Reef Ecosystem Division & Principal Investigator
The first part in appreciating what we have is to know exactly what we have to begin with. Biologists conduct species census in both terrestrial and marine environments, and spend a great deal of time studying each species. But to gain a fuller understanding of an ecosystem, it is also necessary to know the physical characteristics of the environment that provides the foundation for these ecosystems. This is one of the main reasons why we map the seafloor.
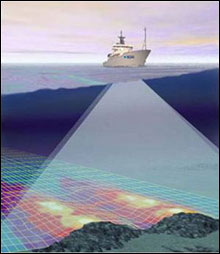 |
| A NOAA ship using the sonar system. (Photo: NOAA) |
The primary objective of this mission is to produce benthic (sea bottom) habitat mapping of Kure and Pearl & Hermes Atolls. We are filling in a doughnut-shaped gap on both Kure and Pearl & Hermes Atolls, finishing a painting of the seafloor that started several expeditions ago. Coral reefs around the world are receiving increased attention because of the many threats that they face (coastal development, overfishing, climate change), and the U.S. Coral Reef Task Force has produced a number of goals and mandates relating to these ecosystems in America. Among these goals is a call for better management of these resources, and to learn more about them. Mapping all U.S. coral reefs puts Hawai`i at the center stage of this effort with its large chain of islands and atolls stretching across vast distances and volcanic islands found at every stage of geological development, from birth to eventual demise.
The primary goal, as far as mapping is concerned, is to have 100% of all shallow coral reefs mapped. The group mapping the Northwestern Hawaiian Islands is a large team comprised of staff from NOAA Fisheries Coral Reef Ecosystem Division, and the University of Hawai`i. They have an exemplary set of tools at their disposal to do their work. Aboard the NOAA ship Hi`ialakai, they employ two sonar systems. Used in conjunction, these sonar systems are slowly giving us a detailed account of the submerged geological features that make up the Hawaiian archipelago.
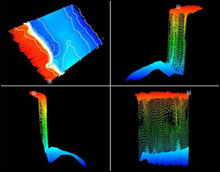 |
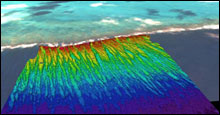
| A bathymetry map showing a 15-meter drop off from several angles. Colors indicate relative depth. (Photo: NOAA Fisheries Coral Reef Ecosystem Division) |
When a ship maps the ocean floor, it needs to slowly cover swath areas under it. The process is very much like painting a wall with a brush. A wall cannot be painted all at once, of course. The painting is accomplished one stroke at a time, where each passing of the brush needs to slightly overlap the previous one, as to not leave any white spaces in between. When mapping the seafloor, the ship, with its sonar as a giant brush, needs to carefully cover every bit of seafloor surface, as to not leave any area between passes, or swaths, blank and unmapped.
The two sonars that we have aboard the ship perform the same task, but each is best suited to work in different conditions. That is because they employ different frequencies which have different rates of penetration. Let’s go back to the analogy of painting a wall. If you have a large wall to paint, you can use a broad brush (or even better, a roller), to cover large areas at every stroke. But within this wall you also have edges that need to be painted more carefully. Let’s say there is a light switch placed in the middle of the wall. Using a painting roller will invariably leave white spaces in between (either that, or you end up also painting the light switch!). So for this light switch, you would use a smaller brush, allowing you to carefully get close to it, eventually covering the entire surface of the wall without painting over it. In this analogy, each light switch in the wall represents an atoll of the archipelago.
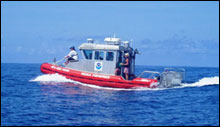 |
| The research vessel Ahi operating in Kure atoll. Note the AC cabin to operate the computer equipment required for the sonar. (Photo: Claire Johnson/NOAA) |
Painting over a light switch would mean running the ship into the reef! So mappers have a set of “ paint brushes” in the form of three sonars that allow them to carefully map each area. There is one low-frequency sonar (using a 300 Kilohertz (kHz) frequency) that has a long wavelength that can map between 100 meters (about 328 feet) and 4,000 meters (about 13,421 feet) - this is the ship’s big roller. There is another, high-frequency sonar (using a frequency of 3002 kHz) that can map when the seafloor is less than 100 meters (about 300 feet) from the surface - this is like a mid-sized brush. There is a third sonar, mounted on a smaller, 25-foot research vessel Ahi (which stands for Acoustic Habitat Investigator), with a sonar working at an even higher frequency, which can get really close to the reef – up to places which are 10 meters in depth (quite shallow, at 30 feet). This little boat is like the small brush used to cover areas right at the edge of what needs to be mapped.
I am going to use the example of sunlight traveling through water to illustrate the way that the ship’s sonar works, both light and sound are waves. Sunlight has many frequencies, frequencies that readily break out into all colors by raindrops or a prism. Red color has the highest frequency and, much like the 3002 kHz sonar, is the first absorbed by water. The color red is the first one to disappear underwater. Take anything cherry-colored down a few meters of water, and it will quickly loose all its brilliance, turning into a dull-looking color, an effect that is magnified with the scarcity of light at nighttime. Fish also know this very well. Many fish which are active at night tend to have a red color. Soldierfish, with their large eyes and flame-red color, are perfectly suited for the night environment.
Blue, at the other end of the visible light spectrum, has a low frequency. Its large wavelength is the last one to be absorbed by particles in the water, and penetrates deep in the ocean. If you are able to go down deep enough, say 100 meters (328 feet), all around you will look blue. I once went on a submarine ride with my sister, and when we reached 45 meters (150 feet) in depth, the entire inside of the submarine was bathed by blue light. I took her picture and, with no camera tricks, it showed how everything had acquired a sapphire hue (see picture).
 |
| A recently completed bathymetry map superimposed with satellite imagery of Kure atoll. Red indicates lowest depth, and blue deepest. Satellite image has white around edge indicating the exposed reef ring. (Photo: NOAA Fisheries Coral Reef Ecosystem Division) |
Now, how exactly does sonar work? The sonar unit emits sound, actually given the descriptive term of “ping.” This ping can be at either the low or high frequency described above. After the ping is emitted the sonar unit “listens” for it to come back. Sonar, therefore, has two essential components: the first one that emits the ping, and the second one that listens for it coming back from the seafloor. This is because when sound hits a surface, some of it is absorbed while the rest bounces back. (If you have many large walls around you, you can hear almost all of your sound coming back at you, this is the echo you hear.) The denser, and flatter the surface, the more of the sound that bounces back.
When the pings return back to the ship from their very quick trip to the ocean floor, the sonar measures (or “listens”) to how long it takes for them to return, and how strong their signals are. To do this accurately, there are over 100 arrays of receivers in the sonar on the bottom of the ship, each carefully calibrated to listen carefully to each echo of a new ping. The pings coming back carry with them two bits of important information: how long they take (known as the “Two-Way Travel Time”) and the strength of the signal. The time it takes for the ping to return depends on how far it needs to travel (of course!) and how fast sound is traveling in the water.
Adding a bit of complexity to this process, the speed of sound is not immutable like the speed of light. In water, it depends on the temperature of the water, its salinity, and depth (all of them affecting the density of water), so careful and constant measurements need to be taken regularly. A large array of devices, collectively known as CTD, are routinely lowered from the main ship into the water. Armed with this information, and by carefully measuring the time it took for the ping to complete its travel, we can know how far each ping had to go. If you do this many times over, you have something called “bathymetry,” a picture of the seafloor.
Putting together shallow and deep water mapping, we soon end up with a seafloor that has been completely painted, full of colors representing depths. An accurate map is essential as a base layer upon which other information can be overlaid, such as bottom cover type – coral, rocks, sand, etc. Mapping, combined with bottom characterization allows us to monitor long-term trends and changes in the marine habitat. This long-term observation is an essential tool for management of the resources. It can serve as one of the indicators for the effectiveness of the conservation efforts, allowing us to make “sound” management decisions.
|