Error processing SSI file
|
Multibeaming During the Nancy Foster Cruise
By Christine Taylor
Office of the National Marine Sanctuaries
During the Nancy Foster Cruise, one of the main missions is to map the seafloor around Gray's Reef National Marine Sanctuary. The most important tool that the ship has in its toolbox for this purpose is the multibeam sonar system.
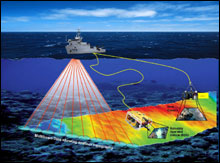 |
| Figure 1 - Illustration of multibeam sonar and various
bottom type identification camera systems. Click here for a larger image.
|
This system sends many sound pulses, known as pings, at one time and at multiple angles into the water from a transducer mounted on the bottom of the ship (see figure 1.) The pings then travel through the water until they reach a surface that reflects sound such as the seafloor or a shipwreck, and then travels back through the water column, where it is picked up by another portion of the multibeam system known as the receiver. The receiver then recognizes the return signal from each original ping, records the time it took to return, and then with a number of other computer calculations (which include the angle of the ping, the position of the ship, the ship's orientation in the water, and sound velocity measurements), calculates a depth measurement for each single ping. By continuously collecting these pings the ship records the bottom depth perpendicular to its direction (across track) and keeps collecting data until the target area has been completely mapped. Section A on Figure 2 shows a completed bathymetric (depth) map for a portion of French Frigate Shoals in the Papahānaumokuākea Marine National Monument.
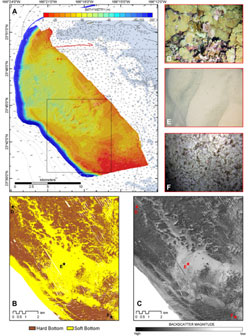 |
| Figure 2 - Multibeam bathymetry (A), Classified Backscatter (B), Backscatter multitude
(C), Bottom type identification photography (D,E,F). Click here for a larger image.
|
Additionally, residual sound waves that originate from the transducer, but are not the primary sounding data, comes back in a form known as backscatter. Once thought to be extra noise that was useless, it has been found to be a good determiner of how hard the bottom is. Along with depth information, backscatter data gives us a sense of the bottom type. Because backscatter is collected at the same time as the depth information, the two data sets can be layered together to show both depth and bottom hardness, and eventually bottom habitat. Section C of Figure 2 is an example of a backscatter image.
By sending a diver or a remotely operated device to the bottom, it is possible to get photographic data from targeted points along the backscatter data and use that information to try and identify all the similar areas on the backscatter as similar to the photographic information collected over those targets. If you do this for each type of return value, you can get a good idea of the type of habitat that is under the water area you have mapped. Sections D,E, & F are examples of bottom habitat photography that is then used to try and classify the backscatter images (section C, Figure 2.) A few directly photographed areas can help to identify habitat types in an entire map area.
Collecting the data from the ship can be a laborious process. Lines must be drawn on a computerized chart to direct the ship's driver where to go, and the shallower an area is, the more lines you have to cover. Once the ship has collected data along a line, it overshoots the area, and loops back around going in the opposite direction in order to start collecting the data on the next line. Participants on a multibeam mapping cruise often refer to this as mowing the lawn for obvious reasons. All the while someone needs to make sure there is good overlap between the lines so as not to allow for holes in the data collection, and to make sure all the instrument settings are sufficient to get enough intensity of sound to reach the seafloor. Additionally, the data is not perfect and must be corrected for differences in tide, sound velocity, and a number of other factors. Then it must be edited for obvious errors in the data in a separate software system. To help minimize errors, every six hours, or as often as needed, a CTD (conductivity temperature and depth) measurement is performed and the data received is entered into software program to account for differences in temperature and salinity of the water column. When all the corrections and editing has been accomplished, a map that looks like the one in Section A of Figure 2 can be created.
|