Mapping of the Flower Garden Banks National Marine Sanctuary
Scientists need to know how animals distribute themselves in order to better manage for their protection and conservation. Some organisms distribute themselves based on the features of the seafloor. In order to determine what is on the seafloor, we need to map it. Mapping provides the critical linkage so that scientists can then effectively monitor the fish and invertebrates, along with any changes which may occur over time.
What is mapping?
 |
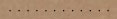
| Figure 1. Example habitat map of Buck Island, USVI coral ecosystems habitats.
|
Although mapping can mean a lot of things to different people, marine scientists in the Flower Gardens Banks use mapping to learn what types of habitats are found on the seafloor. Coral reef ecosystems contain many different types of complex habitats within a short distance. Depending on the location, one could find a variety of corals (hard versus soft, branching versus flat, big versus small), seagrasses, and various other bottom types. As mappers, we call these “biological cover types” the things that grow on and above the seafloor. But these organisms grow on or are attached to something. They may be attached to sand, mud, or even a hard reef created by the coral themselves. Mappers call this part of the seafloor the “structure”. And in some cases, the “structure” may have nothing growing on it at all.
 |
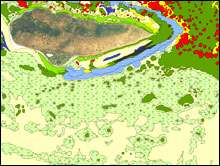
| Figure 2. Ship based multibeam collection and underwater imaging systems. Click here to view a larger image.
|
Although much of the seafloor can be very flat, the Flower Garden Banks represent an area that rises quickly off the seafloor. There are peaks, valleys, holes, crevices, and flat areas, all of which have different kinds of "structure" and "biological cover" types. The rise and fall of the seafloor is known as "topography". Scientists need to know how quickly the seafloor rises and falls since the changes in "topography" combined with "structure" and "biological cover type" of the seafloor, provide important homes, hiding places, food, and breeding areas for a variety of fish and invertebrates.
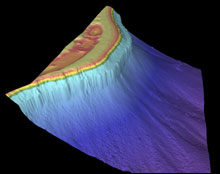 |
| Figure 3. Coral reef seafloor topography at El Hoyo, Puerto Rico.
|
Mapping these locations can be difficult. They can be deep, much deeper than where a diver can go. They are large. Much larger than hundreds of divers could ever visit. They are complicated. Much more complicated than someone can accurately draw with a pen and paper. So the scientists use ships with instruments attached to the bottom of the vessel and then drive back and forth across an area to map it. The ship uses an instrument called a multibeam. Multibeam is a very sophisticated sound maker. It transmits multiple “beams” of sound and listens for the sound return. The time it takes for the sound to return provides information on depth to the seafloor. How loud the sound is tells us something about what is on the seafloor, its structure, and cover. The instrument sends these sound packets out very quickly (multiple per second). All of these data points come back and are recorded and strung together to make a map of what the seafloor looks like. See Figure 1 and 2.
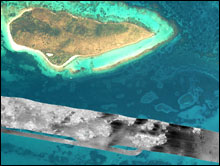 |
| Figure 4. Seafloor habitat intensity generated from a multibeam, Buck Island, USVI.
|
The sound concept is analogous to an echo from your voice. When you yell into the Grand Canyon, the echo from your voice will return. How long it takes tells you how far you are from the canyon wall. Depending on what your sound echoes off of also gives you some clues about what the wall is made of based on the intensity of the echo return. Your voice in a shower (hard walls) sounds stronger than when you are singing in the closet (soft clothes). Sounds reflect better and louder in the shower then off soft clothes in the closet, and your ears can detect the difference. The multibeam works the same way, only it collects data very quickly, in water, and can accurately record where those sound waves are going and returning. The intensity of the sound return describes the composition of the habitats and structures on the seafloor (Figure 4).
Understanding the Seafloor
The data returning to the multibeam is not always easy to understand. We can represent changes in depth or topography using color coded maps, and sound intensity using gray scale maps. But like the ultrasound image of a baby in a mother's womb, it takes a trained expert to distinguish object types from one another. To make this easier and the result more effective, scientists use various underwater imaging systems to take pictures of the seafloor (see Figure 5).
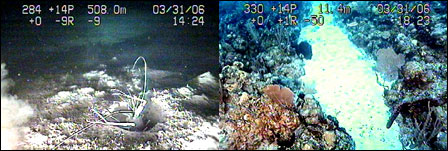 |
| Figure 5. Underwater imagery of seafloor animals and habitats.
|
A Remotely Operated Vehicle (ROV) is a steerable robot that can be sent to the seafloor to take pictures and readings. A drop camera is another imaging system but it is not steerable like an ROV. The ROV is driven by scientists on the ship who can see pictures from the ROV camera just above the seafloor in real-time. They can maneuver the ROV to image areas so that we get a better understanding of the seafloor and better interpret the multibeam data. Using the multibeam data and images from the robot, scientists can then make maps of the information needed including the “biological cover type”, “structure”, and “topography”.
|