 | ||||||||||||||||||||||||||||||||||||||||||||||||||||||||||||||||||||||||||||||||||||||||||||||||||||||||||||||||||||||||||||||||||||||||||||||||||||||||||||||||||||||||||||||||||||||||||||||||||||||||||||||||||||||||||||||||||||
|
|
|
|
|
The following information provides an assessment of the status and trends pertaining to water quality and its effects on the nearshore environment. 1. Are specific or multiple stressors, including changing oceanographic and atmospheric conditions, affecting water quality?
The Central Coast Ambient Monitoring Program (CCAMP) conducted a study between 2001 and 2006 to assess the quality of water, sediment, and tissue samples collected from harbors, including three harbors adjacent to the sanctuary. An EPA Water Quality Index was calculated for samples based on levels of dissolved oxygen, dissolved inorganic nitrogen, ortho-phosphate, chlorophyll, and water clarity. While most of the sampling sites within the sanctuary were found to be healthy, two sites in Moss Landing Harbor were found to be problematic (Sigala et al. 2007). Impaired water bodies include river segments, coastal shorelines, harbors, bays, and estuaries that do not meet or are not expected to meet Federal Clean Water Act water quality standards. The State Water Board and the U.S. EPA have determined that there are a total of 51 impaired waterbodies within watersheds that drain directly to the sanctuary or are within the sanctuary itself (see Figure 18 in Pressures section; SWRCB 2006). These include 37 river segments, six estuaries, two harbors, and six coastal shorelines. This total excludes many impaired waterbodies that flow into San Francisco Bay that are likely to be additional water quality stressors for the sanctuary. The impaired estuaries, harbors, and coastal shorelines are listed in Table 1 along with the pollutants that are the cause of impairment. A number of emerging pollutant threats exist, however, little is known regarding their presence or effects in the environment. In addition, water quality standards for these pollutants, including pyrethroid pesticides, fire retardants (PBDEs), pharmaceuticals, and personal hygiene products, have not yet been developed. Increased input rates of these pollutants have prompted concern in the San Francisco Bay (SFEI 2007) and they may also pose a threat in sanctuary waters. Table 1. Impaired estuaries, harbors, and coastal shorelines adjacent to the MBNMS and impairment causing pollutants. Impaired river segments are not shown. Source: (SWRCB 2006)
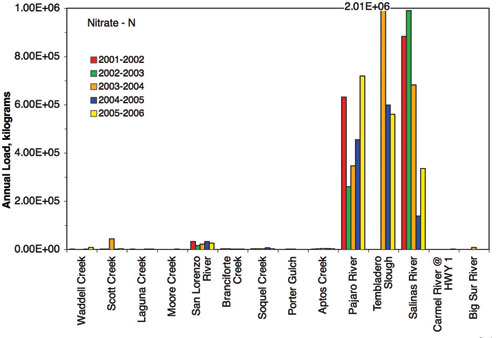
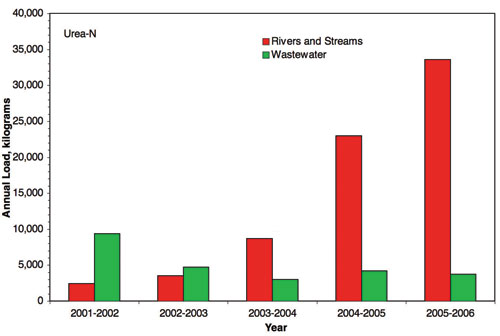
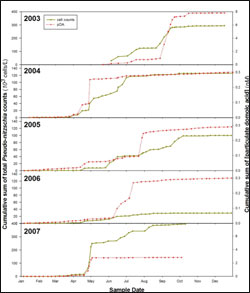
2. What is the eutrophic condition of sanctuary waters and how is it changing? Clear evidence of frequent, localized, and enhanced nutrient enrichment in the nearshore environment of the sanctuary, due to both point and non-point sources was the basis for a “good/fair” rating and a “declining” trend. These conditions may preclude full development of living resource assemblages and habitats, but are not likely to cause substantial or persistent declines. Of the 51 waterbodies draining directly to the sanctuary that were monitored for impairment, 15 were determined to be impaired by elevated nutrient levels (SWRCB 2006). Sources of nutrients, such as phosphorus, nitrate, and urea, to the nearshore environment include waste products from mammals, runoff from agriculture fields, leaking septic tanks, and sewage discharge systems. The most abundant source of nitrate and urea is river discharges and the most abundant source of orthophosphate and ammonia is wastewater (CCLEAN 2007). Rivers vary in their load contributions relative to different nutrients (CCLEAN 2006). Nitrates from the Pajaro and Salinas Rivers and Tembladero Slough are far greater in comparison to other major rivers that drain to the sanctuary (Figure 48) (CCLEAN 2007). Both coastal streams and wastewater effluent contribute urea to nearshore waters; coastal streams contribute higher loads with the Pajaro River and Tembladero Slough being the largest sources (Figure 49) (CCLEAN 2007). In general, nutrient enhancements to the nearshore environment are greatest during winter months coinciding with the high rainfall season. Harmful algal bloom (HAB) events have been linked with freshwater runoff events (Kudela and Chavez 2004) and may be associated with nutrient loading from coastal watersheds in the Monterey Bay (Kudela et al. 2008a; Kudela et al. 2008b). There is sporadic, anecdotal evidence of fish and mussel mortality that may result from HABs. Recent studies suggest a possible relationship between HABs and inputs from coastal watersheds (see Question 2 in the offshore section). The total ecological response of the sanctuary system to the current level of nutrient loading may not yet be evident, since some changes in nutrient loading will be manifested as changes in physiological processes of algae species, rather than rapid changes in biomass (Anderson et al. 2002). Biotoxins produced by HABs have been shown to accumulate in filter feeders, such as anchovy and mussels, and can cause health effects in nearshore mammals and seabirds that consume tainted prey (Fritz et al. 1992, Scholin et al. 2000, Kreuder et al. 2005). For example, a bloom of the diatom Pseudo-nitzschia occurring in Monterey Bay in early September 1991 was linked to an episode of mortality in Brown Pelicans and Brandt's Cormorants (Fritz et al. 1992). High levels of domoic acid were recorded in plankton samples and in anchovies, a principal food source for these seabirds. In addition, Kreuder et al. (2005) found that exposure to domoic acid was a leading risk factor for the development of cardiac disease in beach-cast sea otters.
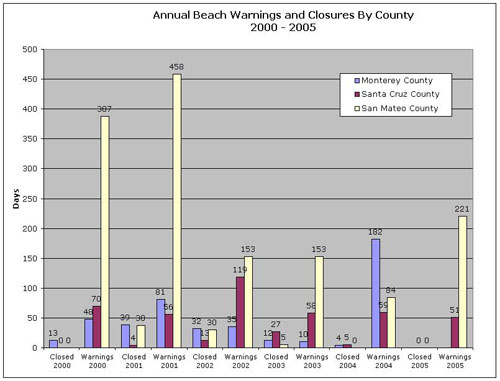
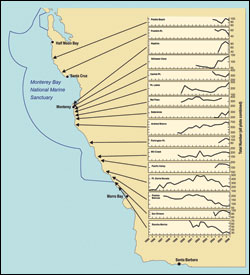
3. Do Sanctuary waters pose risks to human health? Health risks in nearshore waters are rated “fair/poor,” and a trend is “undetermined,” since selected conditions have caused or are likely to cause severe impacts, but cases to date have not suggested a pervasive problem. Although the majority of the sanctuary’s nearshore waters generally do not pose risks to human health, there are localized areas and isolated impacts that pose serious health risks. Pollutants present in nearshore waters are absorbed into the tissues of organisms such as mussels and fish. High levels of contaminants such as pesticides and metals can pose a human consumption risk. Toxins (domoic acid and paralytic shellfish poison) are produced by certain algal species and have been observed at levels in Monterey Bay that are potentially harmful to human health via bioaccumulation in the food web (Jester 2008). An annual statewide mussel quarantine is issued from May 1 to October 31 by the California department of public health to protect consumers of harvested shellfish from paralytic shellfish poisoning (PSP) and domoic acid poisoning. Periodic beach warnings and closures, due to the presence of pathogen indicators (E. coli, fecal coliform, total coliform, Enterococcus) that can cause illness in beach goers, are common at some locations (Rickers and Peters 2006). Several waterbodies directly adjacent to or within the sanctuary are impaired by pathogens (see Table 1, in Nearshore/Water quality section, Question 1; SWRCB 2006). Santa Cruz County monitors the beaches with the highest visitation rates for bacterial contamination between April and October (Figure 50). From 2000-2004 these beaches experienced levels of Enterococcus, E. coli, fecal coliform, and/or total coliform that exceeded State standards 5-20% of the time (Rickers and Peters 2006). The primary sources of bacterial contamination at beaches in Santa Cruz County are coastal lagoons that discharge to the ocean. Coastal lagoons within Santa Cruz County that discharge to the beaches exceeded State standards 50-80% of the time and are permanently posted as unsafe for body contact (Rickers and Peters 2006). Interviews of over 2,100 beachgoers in 2003-04 indicated that overall, 3.83% of swimmers reported illness that was likely caused by water contact. Occurrence of illness doubled during winter periods to 6.86% (Rickers and Peters 2006). Such illness (e.g., earaches, gastrointestinal distress) is typically the result of swimming near an outfall, river mouth, or other impacted area following a runoff event (Rickers and Peters 2006). Six beaches within Santa Cruz County are permanently posted as being generally unsafe for body contact due to regularly high levels of bacterial pathogens.
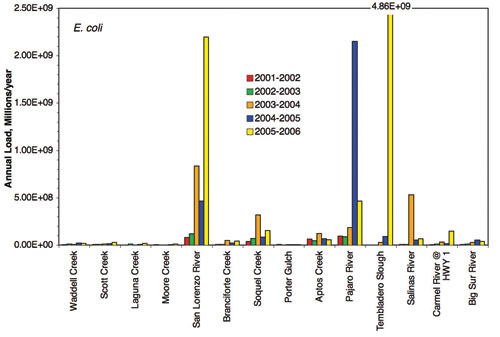
CCLEAN observations indicate that the greatest loads of E. coli (Figure 51) and Enterococcus bacteria to the nearshore environment over the last five years occurred during 2005-2006 at Tembladero Slough and San Lorenzo River, respectively. The San Lorenzo River and the Tembladero Slough are the only sites that seem to have generally increasing bacterial loads over the five years of the CCLEAN program (CCLEAN 2007).
Some of the chemical contaminants found in the nearshore waters of the sanctuary have been detected in the tissues of nearshore animals and in some cases exceed health standards. Mussels at most sites around Monterey Bay sampled by CCLEAN, NOAA’s National Status and Trends, and State Mussel Watch exceeded the California Office of Environmental Health Hazard Assessment human health screening for dieldrin during 2006-2007 (CCLEAN 2007). There have been no statistically significant declines in DDT concentrations in lipid normalized mussel tissues over the last 15–20 years whereas PAHs and PCBs increased marginally at some sites (CCLEAN 2007). The CCLEAN program has concluded that contaminants are present, persistent and exceed allowances set forth in the California Ocean Plan; and recommended issuing a health advisory for mussels (CCLEAN 2007). NOAA’s National Status and Trends’ Mussel Watch program indicates that problem areas for metals and/or POPs within the sanctuary are at Elkhorn Slough, Moss Landing, Pacific Grove, and Santa Cruz Point (Kimbrough 2008). There are decreasing trends at a number of sanctuary sites for butyltins and arsenic, and for chlordanes at San Luis Obispo and an increasing trend for copper at San Simeon. Approximately one-third of the sanctuary sites that were sampled are categorized as high relative to all other U.S. sites for metals and/or POPs and show no increasing or decreasing trends (Kimbrough 2008). The Surface Water Ambient Monitoring Program detected mercury in all samples of fish and shellfish collected from the San Mateo coast in the year 2000 with some sample sites showing concentrations above human health screening levels. Persistent organic compounds were generally low along the San Mateo coast, with only one exceedence for total PCBs. Salmon collected from the San Francisco County coast and the Farallon Islands had no screening value exceedences (SWAMP 2005).
4. What are the levels of human activities that may influence water quality and how are they changing? Human activities detrimental to water quality conditions in the nearshore environment are rated “fair” with an “undetermined” trend, which indicates that selected activities have resulted in measurable resource impacts, but evidence suggests effects are localized, not widespread. Efforts to reduce pollution in the sanctuary may be offset by intensification of human activities in coastal watersheds that introduce pollutants to the nearshore environment. Adequate data to determine the aggregate effect of pollution management efforts and their effects on water quality conditions for watersheds that drain to the sanctuary are not currently available. Pollutants associated with urban development and agricultural cultivation exert pressure on nearshore water quality conditions in the sanctuary. The greatest loads of nutrients and persistent contaminants in the sanctuary are delivered via the rivers that drain heavily cultivated watersheds (Los Huertos et al. 2003, CCLEAN 2007). Regulation of non-point agricultural and urban sources has increased, and the technology, education, and implementation of better rural and urban management practices have improved in recent years via programs such as the Central Coast Regional Water Board’s Agricultural Waiver Program and the State Water Resources Control Board’s Phase II Stormwater Program. In general, sewer systems in watersheds that drain to the sanctuary have been improving because of compliance with city and county management regulations. The County of Santa Cruz has implemented a comprehensive plan to assess and improve urban sources of bacterial pollution including repair of private sewer laterals, public education, and stormwater management (Rickers and Peters 2006). A survey completed by the County of Monterey indicates that nutrient management practices have been widely applied in the Salinas Valley (Monterey County 2002). Surveys by the Central Coast Regional Water Quality Control Board show that nutrient, pesticide, erosion, and irrigation management practices have been applied throughout the Central Coast (RWQCB 2007). 
The following information provides an assessment of the status and trends pertaining to the current state of the nearshore marine environment. 5. What is the abundance and distribution of major habitat types and how is it changing? The abundance and distribution of nearshore habitats is rated “good/fair” based on localized modification or loss of coastal habitat, primarily through armoring of coastal bluffs and beaches, erosion of sandy shoreline, and landslide disposal on rocky reef. The trend in habitat modification is “stable” because coastal armoring continues at a slow pace while dams are being removed in some locations. Though rates of shoreline erosion were found to have increased over the last few decades, the analysis only extended up to the 1998-2002 time period and does not include trends for the last five years. Shoreline habitat type has been determined throughout the sanctuary and in 2006 this information was used to update environmental sensitivity index maps (Research Planning Inc. 2006). In this process the shoreline was classified into 10 different habitat types (e.g., exposed rocky shores, marshes, and sandy beaches) and ranked according to the habitat’s sensitivity to an oil spill. Associated at-risk resources, including biological and human-use resources, also were mapped (available through NOAA Office of Response and Restoration). As of September 2007, approximately 58% of the subtidal benthic habitats in the nearshore environment of the Monterey Bay sanctuary have been mapped with good resolution using sidescan sonar (27%) and multibeam (41%), including some areas of overlap (National Marine Sanctuary: Seafloor Mapping Data Inventory) (see Figure 32 in Offshore/Habitat section, Question 5). A recent comprehensive analysis of long-term (over 100 years) and short-term (1950s-1970s vs. 1998-2002) changes in the abundance of sandy shoreline habitat in California found that the average net long-term shoreline change rate in the central California region was undetectable, but the short-term average net rate was strongly erosional (-0.5 m/yr) (Hapke et al. 2006). This shift to overall increased erosion in the more recent time period may be related to the climatic shift that began in the mid-1970s when California’s climate entered a period of more frequent and stronger storms, including two of the most intense and damaging El Niño winters of the last century (Hapke et al. 2006). Within the central region, short-term rates of shoreline change were calculated as-0.5 m/yr, -0.6 m/yr, and -0.2 m/yr for the San Francisco South, Monterey Bay, and Big Sur regions, respectively. These three regions cover most of the coastline of the entire Monterey Bay National Marine Sanctuary. In the Monterey Bay region, the net average rate of shoreline change more than doubled from the long-term to short-term. The general area within the Monterey Bay region where erosion became more predominant corresponded to the portion of Monterey Bay where sand mining practices throughout the 20th century removed large volumes of sand from beaches and dunes (Griggs et al. 2005, Thornton et al. 2006, as cited in Hapke et al. 2006).
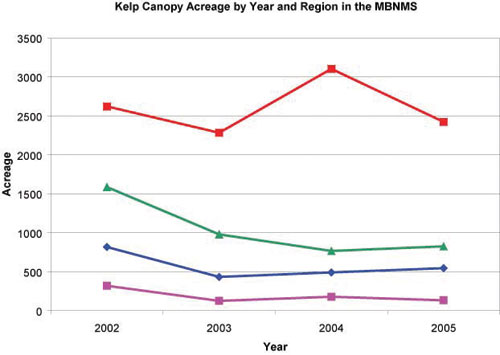
The abundance and distribution of rocky intertidal and subtidal habitats have not been altered substantially in the sanctuary. Some hard bottom intertidal and subtidal sites along the Big Sur coast have been buried by sediment due to landslide disposal, but the impact of this activity is being monitored and appears to be highly localized. Natural, ongoing erosion of the head of the Monterey Canyon (located in the nearshore environment) is converting the habitat at the lip of the canyon from soft sand-mud to hard mud and appears to be moving the lip of the canyon closer to shore (Wong 2006). Continued encroachment of the canyon head threatens the jetties of Moss Landing Harbor and may exacerbate tidal erosion in Elkhorn Slough. 6. What is the condition of biologically structured habitats and how is it changing? Existing data on the condition of biologically-structured habitats in the nearshore environment over the last five years indicate that this resource is in “good” and “stable” condition. A number of on-going monitoring studies in the nearshore subtidal habitats (e.g., Partnership for Interdisciplinary Studies of Coastal Oceans (PISCO); MBNMS monitoring projects) indicate that large, structural algae, seagrasses, and sessile habitat-forming invertebrates (e.g., sponges, anemones, tube worms) appear to be healthy and no major perturbations have been observed. Though kelp is harvested in limited areas in the sanctuary, monitoring data from 2002 to 2005 indicate that canopy-forming kelps have been abundant and healthy (Figure 54; California Department of Fish and Game monitoring data).
On-going monitoring studies in the nearshore subtidal habitats (e.g., PISCO; Multi-Agency Rocky Intertidal Network, MARINe) indicate that some habitat-forming organisms are reduced in abundance in the rocky intertidal habitat compared to historic levels. For example, the abundance of mussels has been reduced at some locations due to repeated harvest for consumption by humans (P. Raimondi, UCSC/PISCO/MARINe, pers. comm.). A study of the impact of human visitation in the Point Piños area found that lower coverage of some types of algae in the upper intertidal zone and around the margins of tidepools may have been caused by chronic trampling from visitors (Tenera Environmental 2003). However, this study also found that for the most part, the abundance and diversity of structure-forming organisms in areas with high visitation did not differ substantially from areas with low levels of visitation. 7. What are the contaminant concentrations in sanctuary habitats and how are they changing? From limited studies of the levels of contaminants in the benthic formations and biogenic organisms in the Monterey Bay National Marine Sanctuary, the condition of nearshore habitats is rated “fair” and “declining” due to elevated contaminants at locations near urban, maritime, or agricultural activities and the continued input of contaminants into coastal waters from point and non-point sources. The Central Coast Ambient Monitoring Program (CCAMP) assessed the environmental condition of central coast harbors including three in the sanctuary (Santa Cruz, Moss Landing, and Monterey) using sediment and tissue samples collected in 2004 (Sigala et al. 2007). Analytes of concern in Santa Cruz Harbor were elevated concentrations of arsenic (in sediment) and total PCBs (in sediment and tissue samples). Chlordane levels were also elevated in sediment and exceeded human health screening values in resident fish populations. Analytes of concern in Moss Landing Harbor were elevated total chlordanes (in sediment) and total DDTs (in sediment and tissue samples). Total PCB levels were also elevated in sediment and exceeded human health screening values in resident flatfish populations. Analytes of concern in Monterey Harbor in both sediment and tissue samples appear to be mercury and total PCBs. Concentrations of lead in resident flatfish populations are elevated compared to the other harbors, but lead does not appear to be a concern in sediment.
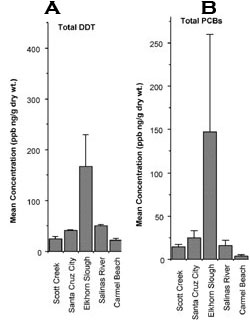
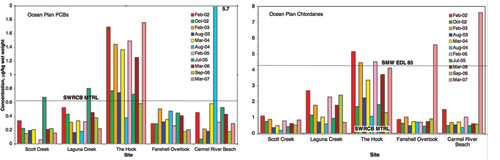
Contaminants in mussels, a type of biogenic habitat, have been monitored twice per year at five sites (Scott Creek, Laguna Creek, The Hook, Fanshell Overlook, Carmel River Beach) in the Monterey Bay region since 2001 (CCLEAN 2006) (Figure 56). Analysis of samples collected from 2001 through 2005 detected elevated concentrations of DDTs, chlordanes, and dieldrin in wet season samples from Laguna Creek and The Hook. The Hook has exceeded the 95th percentile of the most contaminated samples analyzed by State Mussel Watch over a 20-year period for chlordanes, endosulfans, and dieldrin. Every site had mussels that exceeded at least one Maximum Tissue Residue Level set by the State Water Resources Control Board for concentrations of persistent organic pollutants (POPs). There is no evidence that the contaminant levels measured in mussels and sand crabs are having significant negative impacts on those organisms, but there is some evidence that these contaminants are accumulating in animals at higher trophic levels. A recent study conducted by the California Department of Fish and Game tested 227 wild sea otters stranded between 2000 and 2005 for the presence of most major classes of POPs, including PCBs, PBDEs, PAHs, organochlorine pesticides, and organotins. Sea otters with high concentrations of DDT, chlordanes, PCBs, and dieldrin tended to be collected from the same local areas as mussels with high concentrations of POPs (Miller et al. 2007).
8. What are the levels of human activities that may influence habitat quality and how are they changing? The level of human activities that influence habitat quality in the nearshore environment is rated “good/fair” because some human activities can have substantial, localized negative impacts on habitat quality. However, a trend could not be determined due to a lack of information for many of the activities and uncertainty in how to combine the available information into a cumulative trend.
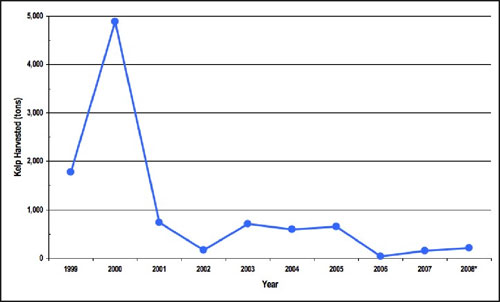
Maintenance of existing armoring structures and development of new structures is a human activity that can impact habitat quality, particularly in the intertidal zone. This activity tends to be clustered near population centers and along sections of the coastal highway. Construction of new armoring structures is strictly regulated by the California Coastal Commission and requires a permit from the Monterey Bay sanctuary if the structure is placed below mean high tide line. There has been no obvious change in the intensity or frequency of this activity in the sanctuary. Most sand mining operations along the coast of Monterey Bay were discontinued in the late 1980s and early 1990s. One mine continues to operate at Marina in southern Monterey Bay. As other mines closed, the operation at Marina increased its extraction to approximately 200,000 cubic yards per year, or the equivalent of all coastal bluff erosion in southern Monterey Bay (PWA 2008). Erosion rates at Marina increased after 1985, and are believed to be related to the increase in sand extraction at the Marina sand mine (PWA 2008). The harvesting of kelp can impact the subtidal habitat. The amount of kelp harvested annually from kelp beds in the Monterey Bay sanctuary decreased over the last decade from a high of 4,880 tons in 2000 to approximately 200 tons in 2008 (Figure 58; data from CDFG Kelp Harvesters Monthly Reports). Kelco, which transferred its kelp harvesting holdings to ISP Alginates in 2001, landed the vast majority of kelp harvested in the sanctuary prior to 2006. This company processed kelp to extract algin, a polysaccharide used in many pharmaceutical, industrial and food products. This company no longer harvests in California, and as of 2006 the majority of kelp harvesters extracting kelp from beds in the sanctuary were abalone farmers (B. Owens, CDFG, pers. comm.). A few individuals have harvested kelp from the sanctuary for other reasons, including scientific research on the impact of kelp harvest on kelp canopy associated fishes.
A variety of land-based and water-based human activities result in the introduction of contaminants, including pesticides, microbial contaminants, and plastic debris, into the nearshore habitats of the sanctuary. These pressures to sanctuary habitats are likely to increase with continued coastal development and population growth. Management programs at the local, regional, and state level attempt to reduce point and non-point sources of contaminants. However, it is unknown whether these programs will be able to offset the increasing pressure of on-going development and population growth on sanctuary habitats.
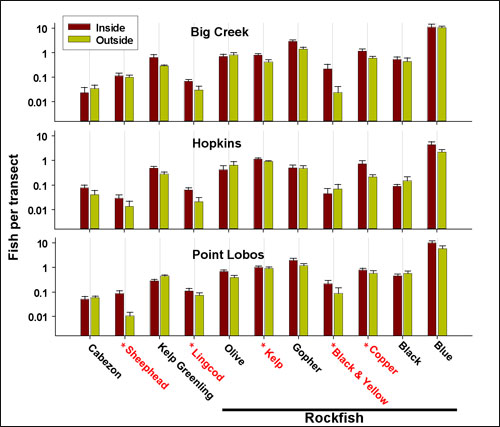
The following information provides an assessment of the status and trends pertaining to the current state of the sanctuary’s living resources in the nearshore environment. 9. What is the status of biodiversity and how is it changing? Species richness in the nearshore habitats of the sanctuary has been unchanged over the last few decades with no local extinctions of native species. However, the relative abundance of native species in the intertidal and nearshore subtidal zones has been altered throughout the sanctuary by a variety of factors including human activities, such as trampling and harvesting for human consumption. The recent implementation of multiple marine reserves and conservation areas in nearshore waters (see Figure 35 in Habitat section, Question 5) may facilitate recovery of reduced populations. Based on these patterns, the status of native biodiversity in the nearshore environment of the sanctuary is rated “fair,” but the overall trend in biodiversity in nearshore habitats could not be determined. The sanctuary’s rocky intertidal community is biologically rich, with 567 native species documented based on surveys of the more conspicuous species (Wasson et al. 2005). Long-term monitoring of the rocky intertidal community is conducted at multiple sites throughout the sanctuary by the Partnership for Interdisciplinary Studies of Coastal Oceans (PISCO) and Multi-Agency Rocky Intertidal Network (MARINe). Based on these surveys, trends in biodiversity differ in different regions of the sanctuary. In the southern portion of the sanctuary, between Ragged Point and Cambria, biodiversity in the rocky intertidal zone has declined in recent years as formerly private lands were opened to the public and subsequently the level of poaching in the intertidal zone in these areas increased (PISCO and MARINe unpubl. monitoring data; P. Raimondi, UCSC/PISCO/MARINe, pers. comm.). The rocky intertidal habitats between Carmel and Año Nuevo are very accessible to the public, and given their proximity to large population centers, it is likely that native biodiversity in these areas has been reduced relative to historic levels (pre-1900s) by both harvesting and trampling (P. Raimondi, UCSC/PISCO/MARINe, pers. comm.). Rocky intertidal areas between Ragged Point and Big Sur are protected from most direct human impacts (e.g., harvesting, trampling) due to limited or no public access. Reduced abundance of some key intertidal species has the potential to alter native biodiversity and impact community structure. For example, black abalone populations at most sites in the sanctuary are at low levels due to a variety of factors including harvesting, sea otter predation, and disease. A recent study found that the composition of the intertidal community shifted after black abalone abundance declined (Miner et al. 2006). Cover of sessile invertebrates and number of sea urchins dramatically increased in areas formerly dominated by bare rock and crustose coralline algae. This shift in the relative abundance of species may be difficult to reverse because it decreases the quality of the habitat for juvenile abalone, thus making recolonization of the area less likely (Miner et al. 2006). In subtidal rocky reefs and kelp forests past fishing practices have altered the relative abundance of targeted and non-targeted fishes (Figure 59) and invertebrates (Starr et al. 2004; PISCO subtidal monitoring data; M. Carr, UCSC/PISCO, pers. comm.). Because these impacts have been ongoing for many decades, there is no expected change in the status of native biodiversity (neither improving nor declining) based on the past five years of data, except possibly in marine reserves where fishing is not allowed and biodiversity may improve. In 2005 and 2006 there was no substantial rockfish recruitment to the nearshore environment, but the reason for this remains unknown (NOAA-SWFSC rockfish recruitment monitoring; PISCO monitoring). There has been a shift in distribution of some subtidal species, including snails, sea slugs, bivalves and brittelstars, along the coast, but the mechanism is unknown (Lonhart and Tupen 2001). Less is known about biodiversity patterns in the sandy bottom habitats of the sanctuary. Some observed changes in biodiversity in the soft bottom habitats of the nearshore environment are likely in response to large-scale, long-term climatic shifts (e.g., Pacific Decadal Oscillation), but data detecting this pattern are limited to a small area (MLML 2006). Monitoring of beaches adjacent to the northern portion of the Monterey Bay sanctuary by the Long-term Monitoring and Experiential Training for Students (LiMPETS) program have found substantial declines in the abundance of mole crabs (George 2008). Mole crabs are an important component in the diet of many fishes, mammals, and birds inhabiting the sandy beach and surf zone and a substantial decline in the availability of this prey resource could impact local food web dynamics.
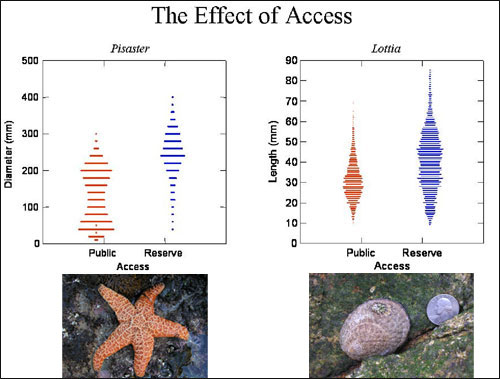
10. What is the status of environmentally sustainable fishing and how is it changing? The status of environmentally sustainable fishing in the nearshore environment is rated “fair” based on evidence that local abundance and size-frequency structures of some targeted species are reduced in areas open to fishing. These changes may influence community and ecosystem level processes in affected areas. However, it is difficult to assess the impacts that altered size-structure and reduced abundance of fished stocks has on ecosystem function since very little research has explored this question. Increasingly restrictive fisheries management strategies implemented by State and Federal agencies, including gear restrictions, bag limits, and closed areas are the basis for an “improving” trend. Overall, sustainable fisheries in the rocky intertidal zone appear to be in fair condition, but the trend is declining in areas with elevated levels of human access and harvesting. Long-term monitoring of the rocky intertidal community has found that the abundance and size structure of some large, mobile species, such as sea stars and limpets, are lower in areas with easy access to the public as compared to areas where public access is difficult or prohibited (Figure 60) (PISCO intertidal monitoring data). The California Department of Fish and Game regulates harvest of many intertidal species, including owl limpets and black abalone. Commercial harvest of owl limpets is illegal throughout California and, where recreational harvest is allowed, the daily bag limit is 35 individuals. However, high-intensity poaching events (hundreds to thousands of individuals collected) have been observed at locations in central and southern California. Sagarin et al. (2007) found that sites with low levels of enforcement against poaching tended to have limpet populations with reduced size structure compared to areas with higher levels of enforcement. The commercial and recreational fishery for black abalone has been closed since 1993. However, poaching of black abalone occurs at some sites in the Monterey Bay sanctuary (P. Raimondi, UCSC/PISCO/MARINe, pers. comm.) and may contribute to changes in the structure of intertidal communities that are observed following declines in abundance of this species (Miner et al. 2006).
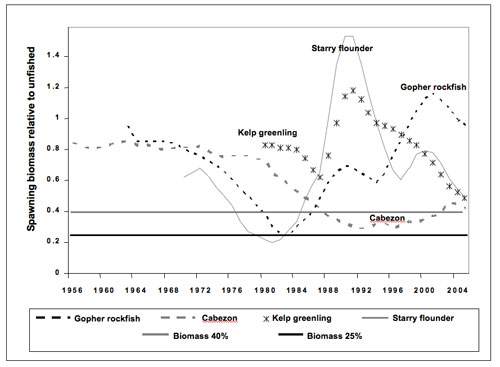
The species commonly landed by recreational and commercial fisheries in the nearshore subtidal environment of the sanctuary include rockfishes, salmon, lingcod, cabezon, California halibut and other flatfishes (CDFG 2008b). The abundance of many of these species has been reduced compared to non-fished levels; however, it is difficult to determine their current level of abundance because many of the harvested stocks in nearshore waters are not assessed regularly. In 2005, the National Marine Fisheries Service approved stock assessments of four nearshore species: gopher rockfish, cabezon, kelp greenling, and starry flounder. These species were found to be above the fishery management target of 40% of unfished spawning biomass (Figure 61). However, cabezon, kelp greenling, and starry flounder were approximately 50% of the unfished level, and the combined removal of significant biomass of multiple stocks has the potential to alter nearshore ecosystems in the sanctuary. For example, there is evidence that local abundance and size-frequency structure for many target species has been reduced in areas open to fishing (Mason 1998, Paddack and Estes 2000, Dorn 2002, Starr et al. 2004; PISCO subtidal monitoring data, see Figure 59 in Question 9). The selective removal of the largest and oldest fish from a population may lead to changes in growth rate, size at maturity, reproductive potential of a population, and the ratio of males to females in species with sexual dimorphism (Berkeley et al. 2004, Palumbi 2004, PISCO 2007).
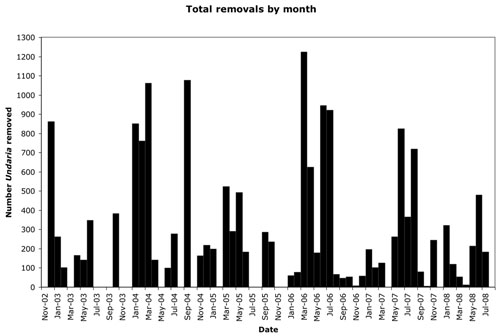
The squid fishery (the highest gross value fishery in the state) is in good condition but it is strongly influenced by oceanographic conditions, making this fishery highly variable (Porzio and Brady 2008). There are no known issues of physical bottom damage related to squid harvesting. It is unknown how squid harvesting directly or indirectly affects the ecosystem as a whole. Recreational and commercial fisheries management in the nearshore environment has become more restrictive since the 1990s. New regulations, including stricter bag limits and gear restrictions, have reduced the harvest of some species (e.g., bocaccio, kelp greenling, lingcod, cabezon). Harvest has been prohibited in some cases (e.g., abalone, canary rockfish, salmon in certain years). The number of nearshore fishes taken in the live-fish fishery has declined recently due to changes in management; the fishery was changed to a restricted access fishery in which the number of participants receiving permits is strictly managed. In addition, 29 marine protected areas were implemented in September 2007 along the central California coast under the Marine Life Protection Act (see Figure 35 in Offshore/Habitat section, Question 5). Some of these areas completely prohibit take of all species while others allow limited take of certain species with approved gears. These regulatory changes have helped improve the status of some previously overfished stocks (e.g., cabezon) and are likely to lead to an improving trend in the status of environmentally sustainable fishing in the sanctuary. 11. What is the status of non-indigenous species and how is it changing? Non-indigenous species have been identified in the nearshore habitat of the sanctuary and a few of these species appear to be spreading. Therefore, this question is rated “good” with a “declining” trend. Surveys of rocky intertidal areas on the open coast adjacent to Elkhorn Slough documented 588 species, of which eight were introduced and 13 were cryptogenic (i.e., possibly native or possibly introduced) (Wasson et al. 2005). Maloney et al. (2006) sampled four very distinct habitats throughout California (sandy and rocky intertidal and sandy and rocky subtidal), with many of the sites located in the sanctuary. The percentage of introduced species was very similar among habitats (1-2%), but the actual numbers of introduced species identified from each habitat type varied: 16 were found in the rocky intertidal, 12 in the rocky subtidal habitat, and seven each in the sandy intertidal and subtidal habitats. Of the 26 introduced species identified along the outer coast, six were not previously known from California and at least six other introduced species had recently expanded from bays or estuarine habitats onto the outer coast. The invasive Asian kelp, Undaria pinnatifida, was first identified in Monterey Harbor in August 2001 (Note: harbors are adjacent to, but not within the boundaries of the sanctuary). This species is a concern because of its relatively quick growth rate and wide blades that allow this seaweed to shade native understory algae. The Monterey Bay sanctuary has led an effort to monitor and remove this species from the harbor. Between December 2002 and July 2008, 120 surveys were conducted and 17,522 individual Undaria were manually removed from the harbor (Figure 62). Despite this extensive removal effort, there was no overall decline in the number of Undaria in the harbor over time (S. Lonhart, MBNMS, unpubl. data). Some vessels in the Monterey Harbor frequent Southern California harbors infested with Undaria and these vessels may periodically re-inoculate the Monterey harbor. Because many established invaders subsequently spread from the point of initial introduction, it is likely only a matter of time before this two-meter-long kelp reaches the breakwater and subtidal reefs in front of Cannery Row.
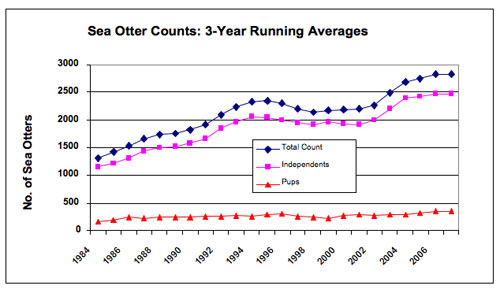
Other surveys (S. Lonhart, MBNMS, unpubl. data) have documented the spread of the introduced Japanese bryozoan, Watersipora subtorquata. This deep-red colonial animal, which forms brittle crusts and erect coral-like heads, cannot be eradicated by manual removal, since even small fragments can reproduce and spread asexually. This species smothers other organisms by growing on top of them, covering areas 1-2 meters in diameter. In the 1990s, this species was limited to harbors, but in early 2000 it was observed on the open coast at the Hopkins Marine Life Refuge. It is also on man-made structures in Moss Landing at depths of 15 meters. Another introduced seaweed from Japan, Sargassum muticum, has spread along the entire eastern Pacific from Baja California to Alaska. This species has apparently stabilized and has equivocal impacts on subtidal communities (Inderjit et al. 2006). A red alga, Caulacanthus ustulatus, is also present in some Southern California rocky intertidal areas (Maloney et al. 2006), but in the sanctuary it is only found on riprap in Elkhorn Slough. 12. What is the status of key species and how is it changing? The status of key species in the nearshore environment is rated “good/fair” and the trend is “not changing” because of the reduced abundance of a limited number of key species in each habitat type. Key species in the rocky intertidal and subtidal zones include abalone, sea urchins, mussels, and habitat-forming algae. Abalone populations are severely depleted due to over-harvesting, sea otter predation, and disease (Haaker et al. 2004). Abalone are ecologically important herbivores that alter community structure by grazing on algae. Juvenile abalone are important prey for other species (e.g., cabezon, sea otters). Black abalone, historically the most abundant intertidal abalone species, has been decimated in southern and south-central California by withering syndrome (PISCO / MARINe intertidal monitoring data). Perhaps because of this decline in abalone, the status of habitat-forming algae is good (PISCO / MARINe intertidal monitoring data). Mussels provide important structure and biogenic habitat for dozens of other organisms. They are declining at some sites because of harvesting for human consumption and as bait for shoreline fishing (PISCO / MARINe intertidal monitoring data). Black Oystercatchers are important avian predators of limpets (another important herbivore in the rocky intertidal zone), but the birds disappear from areas with human visitation, which is increasing along the coast as private lands are opened up to the public. At some sites with high public use, trampling of algae and invertebrates is another significant human impact (Tenera Environmental 2003). The kelp forest community is monitored at multiple sites in the Monterey Bay sanctuary by PISCO, the Cooperative Research and Assessment of Nearshore Ecosystems (CRANE) program, and sanctuary staff. The status of some key subtidal species, particularly kelp and sea urchins, appears to be good (PISCO/MBNMS subtidal monitoring). Rockfishes, cabezon, and lingcod are important residents of the nearshore subtidal zone and the abundance of these stocks has been reduced (to varying extents depending on the species) by recreational and commercial harvest. However, with new fishing regulations, most species with reduced population sizes have responded positively. For example, lingcod is rebounding quickly from very low levels in the early 1990s (Jagielo and Wallace 2005), while cabezon is showing a slower rate of recovery (Cope and Punt 2005, see Figure 61 in Question 10). Sea otter numbers in central California are well below pre-harvest levels, and multiple mechanisms have been proposed to explain why the population has not rebounded quickly over the past 40 years (U.S. Fish and Wildlife Service 2003). In 1982, scientists at the USGS Western Ecological Research Center (WERC) developed and began using a standardized method to survey sea otters. Since 1999, counts have been quite variable, with a slight increasing trend over the whole range (Figure 63). Population trends for the southern sea otter are monitored using the three-year running average of the spring census counts (note that the census provides an uncorrected count of the entire population, and not a formal population estimate). The uncorrected total spring count for 2008 is 2,760, while the three-year running average count for 2007 (the average of the 2006, 2007, and 2008 spring counts) is 2,826.
Nearshore soft-bottom habitats in the shallow subtidal zone used to have high densities of Pismo clams (Tivela stultorum), but these populations have been decimated by the return of sea otters (Kim et al. 2006). Sand dollar beds, a type of biologically structured habitat found just beyond the surf zone, have not been monitored so their status is unknown. At depths greater than seven meters the ornate tubeworm, Diopatra ornata, is an important and ubiquitous stabilizing organism, and also provides structure and habitat for other organisms. Again, the status of this species is not being monitored. 13. What is the condition or health of key species and how is it changing? The health of key species in the nearshore environment is rated “fair” because the health of some key species is negatively impacted by disease or chemical contaminants. The trend is rated as “unchanging” because impacted populations are generally not declining in the sanctuary, but decreased health appears to be one reason that the populations are not recovering from depressed levels.
The sluggish recovery of the southern sea otter cannot be attributed to any single cause, but instead is the result of multiple impacts to the health of the population (U.S. Fish and Wildlife Service 2003). Infection or disease was found to be the cause of death in approximately half of fresh condition beach cast southern sea otters recovered over a 12-year period (Tinker et al. 2006). Diseases affecting southern sea otters include protozoal infections (including Toxoplasma gondii and Sarcocystis neurona), infections with thorny headed worms (Profilicolis spp.), and domoic acid intoxication from harmful algal blooms. Exposure to chemical contaminants is another threat to the sea otter population. A recent study conducted by the Department of Fish and Game tested 227 wild sea otters stranded between 2000 and 2005 along the California coast for the presence of most major classes of persistent organic pollutants. DDTs had the highest mean liver concentrations of all major contaminant groups, followed by PCBs, and PBDEs (Miller et al. 2007). In addition, there is some indication that food resource limitation is a significant factor limiting population growth in at least some parts of their range (Oftedal et al. 2007, Tinker et al. 2006). Recent studies suggest that exposure to one threat may make an animal more susceptible to others (Miller et al. 2007, Kreuder et al. 2003). For example, Kannan et al. (2006) found a significant association between infectious diseases and elevated concentrations of perfluorochemicals in the livers of adult female sea otters collected from the California coast during 1992-2002. Environmental contaminants may compromise the otters’ immune response or weaken them in some other way, which predisposes sea otters to disease-induced mortality. 14. What are the levels of human activities that may influence living resource quality and how are they changing? The status of human activities that may influence living resource quality in the nearshore environment is rated “fair” and the trend is “declining” because, in general, a number of human activities have negative impacts and most of these activities are continuing at current levels or are increasing in intensity. As more private lands along the coast are opened to public access, extraction - both legal and illegal - has increased in the rocky intertidal zone (P. Raimondi, UCSC/PISCO/MARINe, pers. comm.). Poaching is particularly problematic, and it is unlikely that enforcement efforts will ever match those of the poachers. Additional funding and personnel are needed to increase monitoring, enforcement, and public education efforts. Increased access also increases damage due to non-extractive activities, such as trampling, turning over rocks, flushing birds and marine mammals (Tenera Environmental 2003). Additional restrictive measures, including seasonal closures, bag limits, and new area closures created under the Marine Life Protection Act (see Figure 35 in Offshore/Habitat section, Question 5) have been implemented in the nearshore environment by fisheries management. These changes in fisheries management may result in decreases in the overall fishing effort, but may also lead to redistribution of fishing effort and increased pressure in areas open to fishing. In contrast to the chronic pressure of humans along accessible sections of the rocky coastline, oil spills, although relatively rare, can have a tremendous impact on intertidal resources. Similarly, landslides occur infrequently on the Big Sur coast, but when they do, entire sections of the coastline are buried, and it can be decades before natural processes remove the intertidal and subtidal debris (Carr et al. 2006). Organisms living in sandy beach and subtidal habitats also face several threats due to human activities. These include coastal armoring to reduce bluff erosion and protect buildings, grooming of the sand at popular beaches, sand mining (in the city of Marina), disposal of harbor dredge spoils, and the placement of outfalls from storm drains, sewage treatment facilities, desalination plants, and power plants. Recreational use can also negatively impact beach organisms. For example kite flying, horseback riding and dogs off leash can disturb birds, while picnicking increases trash.
The following information provides an assessment of the status and trends pertaining to the current state of the maritime archaeological resources in the nearshore environment. 15. What is the integrity of known maritime archaeological resources and how is it changing? The integrity of the known maritime archaeological resources in nearshore habitats is rated “fair.” Little is known about the submerged maritime archaeological resources in the nearshore environment of the sanctuary. To date, only one nearshore archaeological site location inventory has been conducted in the nearshore environment of Monterey Bay sanctuary (1979-1981 National Park Service inventoried the California Gold Rush passenger steamship Tennessee lost 1853) (Schwemmer 2006b). No other site evaluations have been conducted by Federal, State, or private resource management agencies in the nearshore environment.
16. Do known maritime archaeological resources pose an environmental hazard and is this threat changing? The known maritime archaeological resources in the nearshore environment are rated as “good” and “not changing” in terms of posing an environmental hazard. Based on the sanctuary’s inventory of known maritime archaeological resources in the shallow water (50 feet or 15 meters, or less), it is unlikely that the remains of shipwrecks hold hazardous cargos and/or bunker fuels. This is also true for shipwrecks located near the entrance to San Francisco Bay (just beyond the sanctuary boundary) that were either dynamited as a hazard to navigation or were part of the city of San Francisco’s efforts to clear wrecks above the waterline that were considered unsightly. Sites in shallow water environments within higher energy zones are subjected to vessel hull collapse by waves, shifting sands, and strong currents. Known maritime archaeological resources in the nearshore pose few or no environmental threats, and the trend is not changing. 17. What are the levels of human activities that may influence maritime archaeological resource quality and how are they changing? Human activity influencing maritime archaeological resources in the nearshore environment is rated “good/fair.” Several human activities may influence the quality of maritime archeological resources in the nearshore environment including the removal of artifacts from archeological sites, diving, anchoring, and fishing activities (e.g., trawling, other gear impacts). Local museums and historical societies exhibit artifacts that were removed from archaeological resources prior to the establishment of Monterey Bay National Marine Sanctuary. Site looting (where objects are intentionally pilfered from submerged sites) may pose a major threat to submerged archaeological resources. Divers visiting sites may cause injury through poor diving techniques, inadvertently holding onto fragile artifacts or striking them with SCUBA tanks. Vessel activity, such as anchor drags or modern ship groundings, can also cause serious injury to submerged archaeological resources. Currently, bottom trawling is prohibited in California state waters, but historically trawling may have impacted resources. These potential impacts have not been measured, but for the known archeological sites, current human activities do not appear to have a significant negative impact on the integrity of these resources. The trend is “undetermined.”
Error processing SSI file |
|
|||||||||||||||||||||||||||||||||||||||||||||||||||||||||||||||||||||||||||||||||||||||||||||||||||||||||||||||||||||||||||||||||||||||||||||||||||||||||||||||||||||||||||||||||||||||||||||||||||||||||||||||||||||||||||||||
|
||||||||||||||||||||||||||||||||||||||||||||||||||||||||||||||||||||||||||||||||||||||||||||||||||||||||||||||||||||||||||||||||||||||||||||||||||||||||||||||||||||||||||||||||||||||||||||||||||||||||||||||||||||||||||||||||||||