Data Accessibility and Application
Conservation Issue
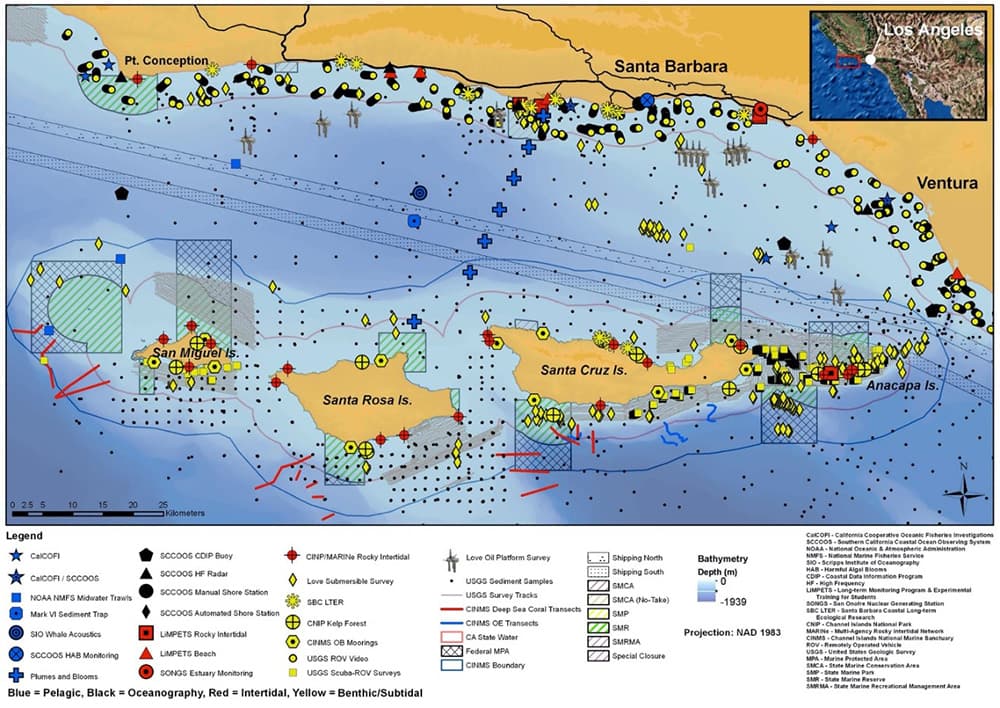
A wealth of observing and monitoring data are collected in Channel Islands National Marine Sanctuary (CINMS) and the broader Southern California Bight by federal, state, and local agencies; academic institutions; and non-governmental organizations. These data are critical for tracking how sanctuary resources are changing and reporting those changes to sanctuary managers and stakeholders. Access to timely information on current status, and recent changes, in key indicators of sanctuary condition is vital for effectively evaluating management strategies and informing policy. Currently, there are limitations to data accessibility for analysis and application that hinder the timely assessment of sanctuary indicators, as well as the evaluation and implementation of responsive management actions.
Description
Timely assessment of sanctuary condition and responsive sanctuary management require data streams that are readily available to science teams, analyzed at spatial and temporal scales relevant to sanctuary management, and presented in accessible and easily digestible formats. CINMS has developed a web-based, interactive tool to facilitate access to, and visualization of, ecosystem tracking and summary assessment information for resource managers, scientists, educators, and the public. However, the effectiveness of this tool is hindered by the limited availability of many regional monitoring datasets necessary for tracking status and change in key indicators. When summary data products are available, they are often presented at temporal or spatial scales that are not well matched with the needs of sanctuary assessment and management. CINMS is working with regional monitoring partners to identify ways to make their data more compatible for integration into CINMS (as well as other) data visualization and communication tools at the most appropriate temporal and spatial scales for analysis to address sanctuary needs.
Data and Analysis Needs
- Time series and geospatial analyses to assess current status and recent changes relative to conditions observed in the past for key indicators of (1) habitat and living resource condition in six major habitats, (2) climate and ocean drivers, and (3) human activities and impacts in CINMS
- Evaluation of the most informative and responsive metrics for key indicators to inform condition reporting and management evaluation
- Identification of ecological tipping points or thresholds to inform risk assessment or management actions
- Evaluation of the appropriate spatial scale for reporting on status and trends of sanctuary resources based on monitoring data collected at different geographic scales
Potential Products
- Accessible, periodically updated data repositories (some existing platforms that already support this effort include CeNCOOS, SCCOOS, and MBON data portals; THREDDS; ERRDAP; DataONE; and Google Drive)
- Raw data that are stored, served, and available to be used in synthesized sanctuary data products (some existing platforms that already support this effort include CeNCOOS, SCCOOS, and MBON data portals; DataONE; and ERDDAP)
- Synthesized data products (for example, graphs and maps) at temporal and spatial scales relevant to the sanctuary and/or region that have been vetted and are ready to be shared in publicly accessible reports
- Report with analysis and recommendations for informative metrics, spatial and temporal scales of analysis, and/or tipping points or thresholds for key indicators
For more information about this assessment, contact research.CINMS@noaa.gov