State of Sanctuary Resources: Nearshore Environment
Monterey Bay National Marine Sanctuary
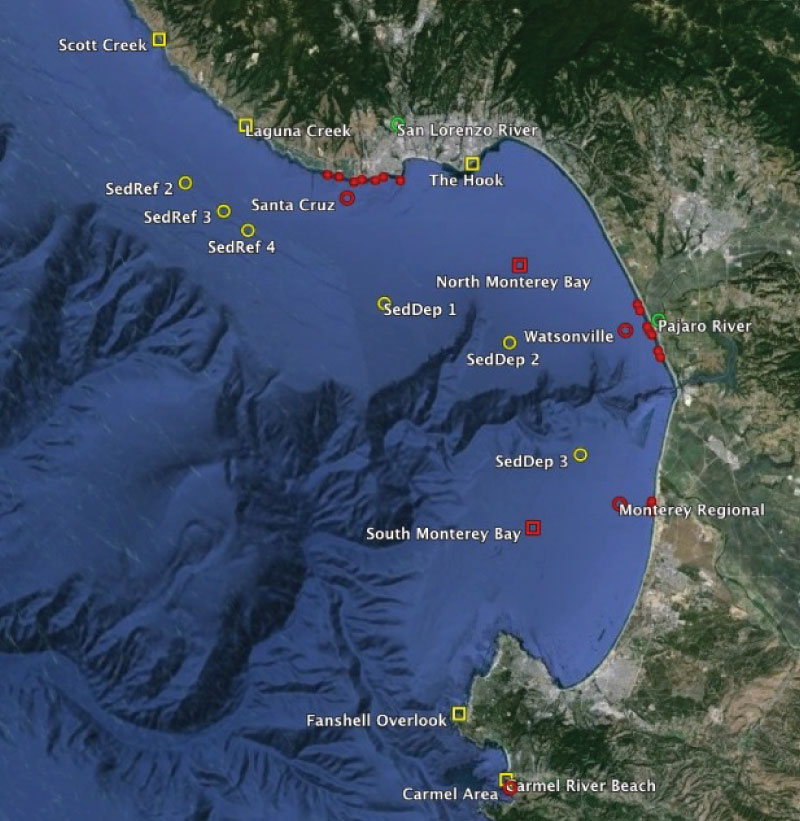
The nearshore environment, which includes the shoreline out to a depth of 30 meters (see Figure 1), is the main zone of interaction between humans and the sanctuary. This is the zone where most residents and visitors interact with sanctuary resources and where most human activities have the strongest influence. As such, this environment is the focus of substantial research and resource management attention.
Long-term monitoring along rocky shores and in kelp forests shows that biogenic habitat, including canopy-forming kelp, understory algae and many structure-forming invertebrates, have been generally abundant and stable. The number of native species in sanctuary habitats, one measure of biodiversity, appears to be stable with no known losses of native species. Though some non-native species are present in the sanctuary, no new introductions are known to have occurred in any of the sanctuary’s environments. Most regularly monitored key species and species assemblages in the sanctuary appear to be stable or slightly improving in status. Recent drastic declines in sea stars, a key species in nearshore habitats, are a concern, but potential impacts on ecological function and biodiversity will take time to understand.
Habitats along less developed portions of the coast (e.g., Big Sur) are in good condition, but there are concerns about localized on-going activities, including sand mining, coastal armoring, inputs of contaminants and marine debris. In the past five years, a high percentage of the sanctuary’s beaches regularly monitored for swimming safety have received good grades, likely due to improvements in sanitary sewer infrastructure in coastal cities. The nearshore waters continue to receive nutrient enrichments from land-based activities, which can intensify the effects of harmful algal blooms (HABs) on sensitive species. Decreases in persistent organic pollutants (dieldrin, DDT, PBDEs [polybrominated diphenyl ethers]) were observed in mussels at five locations, but there is limited information available on new pollutants, such as current-use pesticides and pharmaceuticals. Larger, more global issues, such as climate change and an ocean acidification, are significant areas of concern and detecting and predicting impacts is a focus of long-term monitoring efforts
Nearshore Environment: Water Quality
The following information provides an assessment of the status and trends pertaining to water quality and its effects on the nearshore environment.
1. Are specific or multiple stressors, including changing oceanographic and atmospheric conditions, affecting water quality?
Information regarding stressors on water quality in the nearshore environment, particularly inputs of contaminants (e.g., POPs, heavy metals), nutrients, sediments and pathogens has not changed this question’s rating in the last five years. Their presence may inhibit the development of assemblages and may cause measurable, but not severe declines in living resources and habitats. For this reason, the question’s rating remains “fair” and the trend remains “declining.” Measurements of ambient toxicity due to pesticides (e.g., toxaphene, DDT, diazinon, chlorpyrifos, pyrethroids, neonicotinoids) in waterways that drain to the sanctuary indicate a potential problem in the adjacent nearshore environment (Anderson et al. 2003, Hunt et al. 1999, Phillips et al. 2014, Starner and Goh 2012). Please see the 2009 MBNMS Condition Report for additional information.
Current monitoring is insufficient to allow an accurate determination of sanctuary water quality and its effects on biological resources. Only a small fraction of known contaminants are measured, and even these are measured infrequently. Whole contaminant categories are essentially unmeasured, including endocrine disrupters, personal care products and most current-use pesticides. There is a critical need for a coordinated regional water quality monitoring program to provide an integrated assessment across the range of stressors, jurisdictions and information needs.
In regards to changing oceanographic and atmospheric conditions, Booth et al. (2012) shows an increasing frequency of decreased pH and decreased dissolved oxygen conditions at the Monterey Bay Aquarium seawater intake at a depth of 17 meters. Ocean acidification and decreasing dissolved oxygen is discussed in more detail in Offshore Question 1. In the future, more directed study on the effects of climate driven changes in pH, temperature and dissolved oxygen on nearshore water quality will become increasingly important for understanding and tracking the status and condition of living resources in the sanctuary.
California is invested in a coastwide effort, the West Coast Ocean Acidification and Hypoxia Science Panel, which is scheduled to release a suite of products throughout 2015. These products, which are intended to help inform decision makers and managers, include a synthesis of the drivers of ocean and coastal acidification and hypoxia and a monitoring framework to track changing ocean chemistry.
2. What is the eutrophic condition of sanctuary waters and how is it changing?
In 2009, the status, "good/fair", and the trend, "declining", were based off of clear evidence of frequent, localized and enhanced nutrient enrichment from both point and non-point sources in the sanctuary’s nearshore environment. These conditions may preclude full development of living resource assemblages and habitats, but are not likely to cause substantial or persistent declines (see 2009 MBNMS Condition Report for specifics). The 2015 rating has been changed to "fair" with a "declining" trend due to continued nutrient enrichment; the increased frequency of blooms of Pseudo-nitzschia, in addition to recent new species; and harmful algal blooms’ (HABs) negative effects on fish, birds and mammals. New data indicates that HABs have measurable impacts on nearshore water quality and living resources. Additional information on HABs is presented below and in the offshore environment response to this question.
While upwelling is believed to initiate macro-scale algal blooms, the Monterey Bay’s northeast corner seems to have a bloom incubator "hot spot" in an upwelling shadow that is influenced by runoff from nearby rivers with significant nutrient loads (Ryan et al. 2008). This phenomenon is also described in other areas of the central coast, such as the Santa Maria River to the south (Frolov et al. 2013).
In recent years, orthophosphate concentrations have increased significantly in the Pajaro and Salinas watersheds. Figure 9 shows concentrations of nitrate and orthophosphate at the lower ends of the Pajaro (305THU), Old Salinas (309OLD) and Salinas (309DAV) rivers (CCAMP 2015). Inputs to the sanctuary, from the Salinas and Pajaro rivers, do not show increasing trends in nitrogen compounds. Nitrate concentrations increased in the Old Salinas River through approximately 2011, but have shown recent signs of decline. Regardless of trend, the nitrate concentrations remain high.
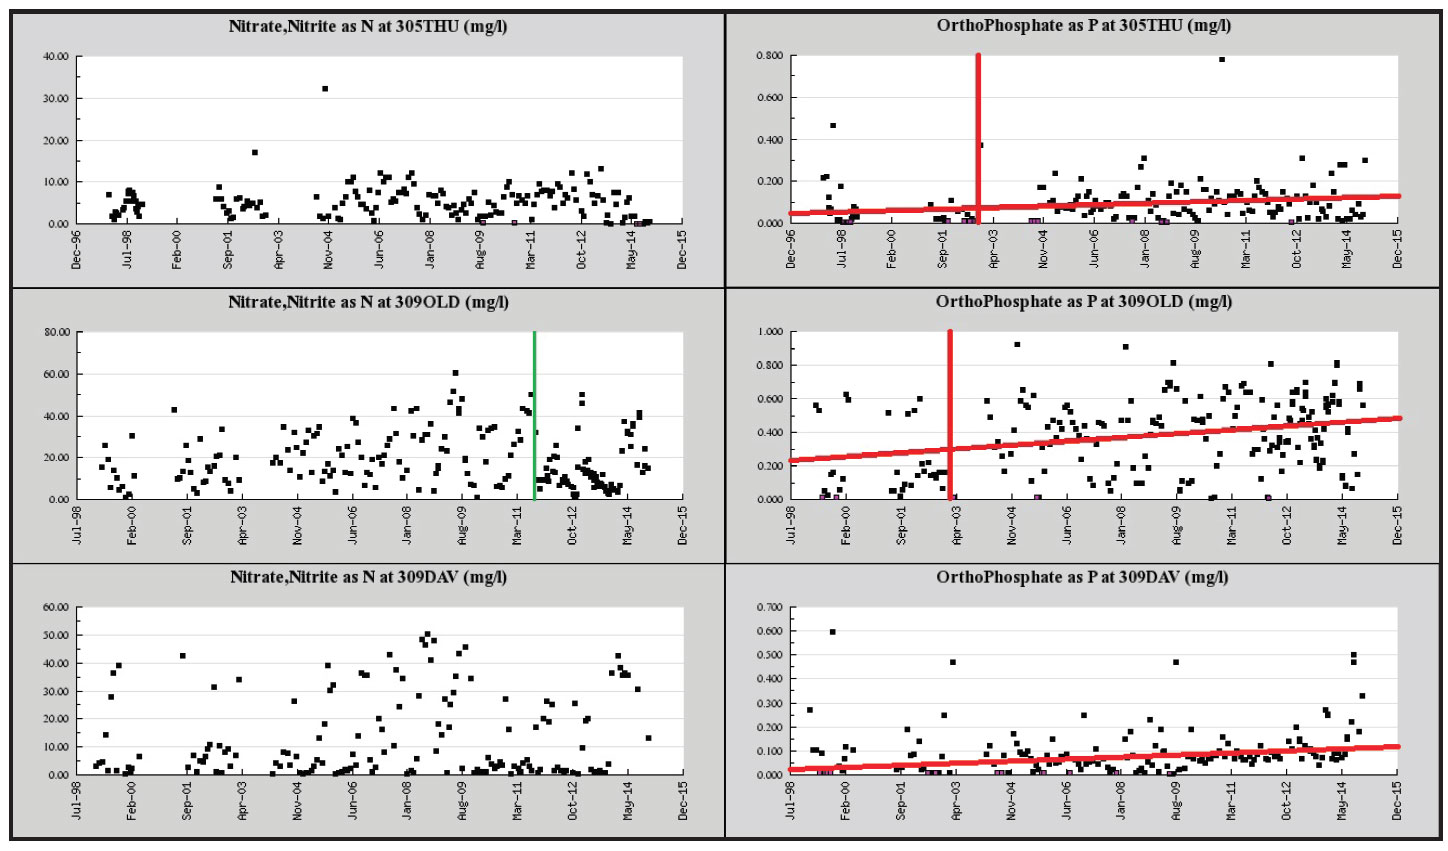
The primary land-based loading of nutrients to Monterey Bay comes from the Pajaro and Salinas River watersheds. Annual loads from the rivers are highly variable and influenced by flow. Because of relatively high flows and concentrations, the Pajaro River contributes the largest loads of nutrients to the sanctuary. San Lorenzo River and Carmel River contribute nutrient loads that are typically an order of magnitude lower. For example, in 2004-2005, the Central Coast Long-Term Environmental Assessment Network (CCLEAN) estimated average annual loads of nitrate from the Pajaro, Salinas, San Lorenzo and Carmel rivers as 271,000 kilogram per year, 214,000 kilogram per year, 28,300 kilogram per year and 34,000 kilogram per year, respectively (CCLEAN 2005). The Pajaro River total maximum daily load (TMDL) estimates that 1.3 million kilogram per year of total nitrogen on average is loaded to streams of the Pajaro River Basin (RWQCB 2015, in draft).
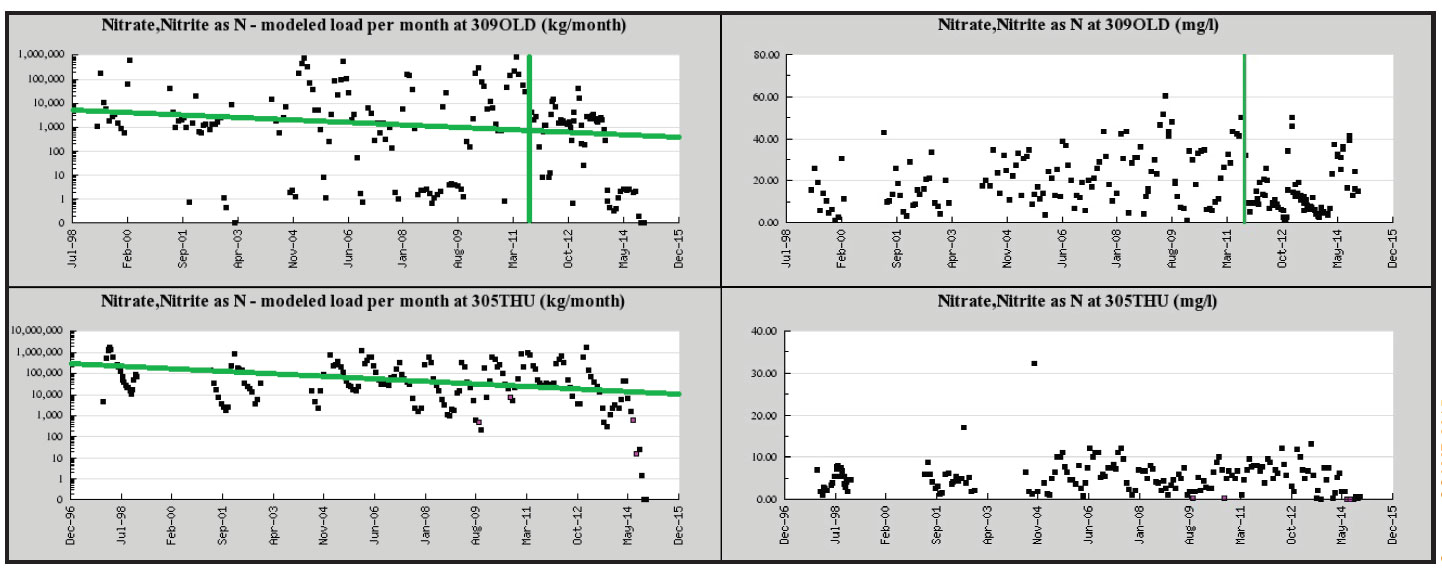
Loading of nutrients may be more important than concentration when considering potential impacts of freshwater inputs on the marine environment, and especially when considering the extended period of recent drought. The CCAMP program has estimated loads using a model that calculates daily river flows with monthly pollutant concentration data (CCAMP 2015). Since 2011, the mouth of the Old Salinas River has shown significant decreases in both the concentration and load of nitrate, and the Pajaro River also has decreasing nitrate loads (Figure 10). In some locations, data from recent years indicate there may be declines in loads of total ammonia, Kjeldahl nitrogen, total suspended solids and turbidity. Again, low flows in 2013 and 2014 may influence these observations.
Harmful algal bloom events have been linked with freshwater runoff events (Kudela and Chavez 2004) and may be associated with nutrient loading from coastal watersheds in the Monterey Bay (Kudela et al. 2008a, Kudela et al. 2008b). Another anthropogenic source of nitrogen comes from publicly owned treatment works (POTW). In a special CCLEAN study, it was determined that wastewater discharges from Monterey Bay area POTWs can contribute up to 80% of the total nitrogen available to phytoplankton during non-upwelling seasons (CCLEAN 2015). However, most studies indicate that the primary trigger for phytoplankton blooms is upwelling. In a 2012 study, the effects of upwelling events, storm water discharge and local circulation on phytoplankton blooms in southern and central California were analyzed using 10 years (1997-2007) of sea surface chlorophyll concentration, sea surface temperature and modeled freshwater discharges (Nezlin et al. 2012). Along the central coast, blooms persisted from spring to autumn during the seasonal intensification of upwelling. As described in Offshore Question 2, Nezlin et al. (2012) concluded that nutrient contributions from terrestrial sources could be negligible at a large scale, but could have a pronounced effect at a local scale in regard to duration and size of bloom, especially near river mouths and areas characterized by extended residence time.
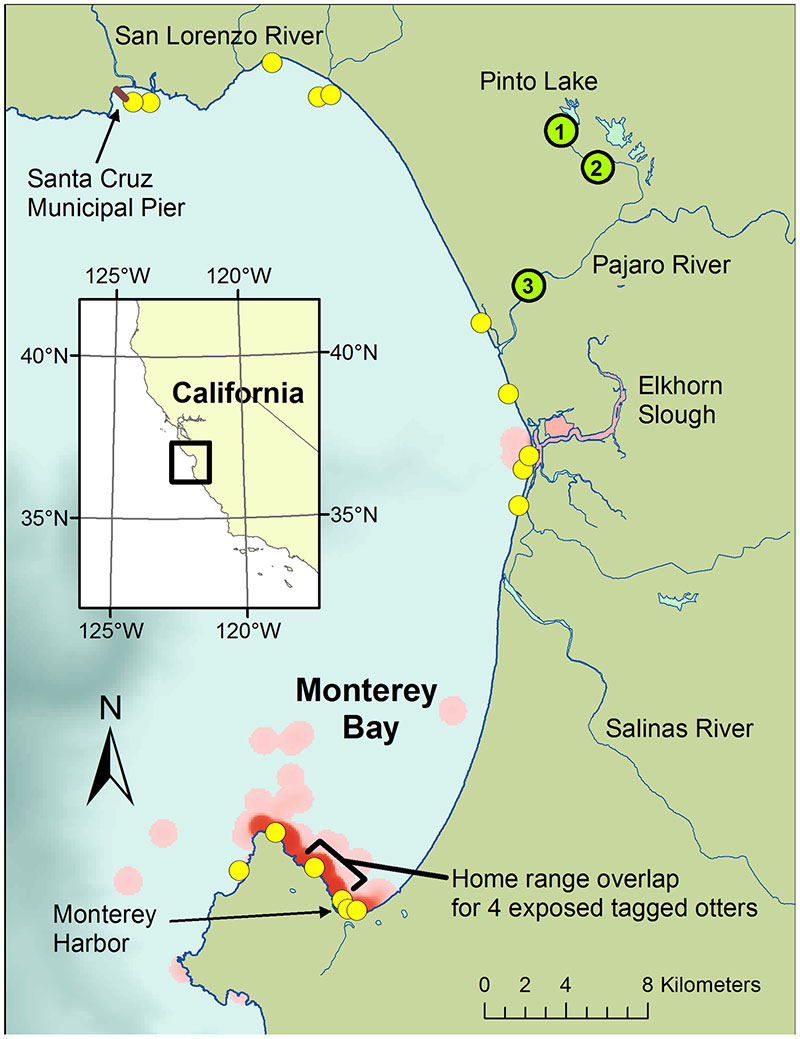
In 2007, the microcystin toxin was determined to affect wildlife in the marine environment. Specifically, 11 southern sea otters were poisoned by microcystin, a toxin produced by the toxic form of Microcystis aeruginosa, which is a freshwater cyanobacterium. Historically, this particular cyanobacterium has been a problem in freshwater systems affecting wildlife on land. As of 2010, at least 21 sea otters have died, most found near embayments, harbors or river mouths (Figure 11). Microcystin was detected in three nutrient-impaired rivers that flow into Monterey Bay: (1.) San Lorenzo, (2.) Salinas and (3.) Pajaro rivers; however, the source of the toxin was ultimately traced to a freshwater lake, Pinto Lake, that connects to the Pajaro River. Results within this land-sea interface had microcystin concentrations as high as 2,900 parts per million (Miller et al. 2010). The suggested action level to reduce potential adverse health effects for microcystin is 0.0008 parts per million (OEHHA 2012). Miller et al. (2010) demonstrated that marine invertebrates, consumed by humans and sea otters, are capable of uptake and retention of microcystin. Even with continual flushing of sea water beginning at 96 hours post-exposure, gastrointestinal microcystin concentrations remained 30.5 parts per billion wet weight 21 days after initial exposure in mussels.
In 2010, 21 freshwater, estuarine and marine locations in California were surveyed using Solid Phase Adsorption Toxin Tracking (SPATT) samplers (Gibble and Kudela 2014) at the land-sea interface to determine the presence and concentration of microcystin. During this initial study, 15 of 21 sites were positive for microcystin toxin. Four watersheds were identified to have persistent concentrations of microcystin toxin (Big Basin, Pajaro, Salinas and Carmel) and further studied for two more years to determine a correlation between other environmental factors. Results indicated that coastal nutrient loading was a statistically significant predictor of microcystin concentrations and those concentrations appeared to have large peaks, especially in the spring and fall. The patterns of microcystin presence and concentration observed during this study suggest that microcystins are likely present throughout the year (Gibble and Kudela 2014) in the nearshore environment.
In 2007, a surfactant producing bloom occurred in Monterey Bay, but it was not documented in the 2009 Condition Report. It affected 14 species of seabirds by coating their feathers with a slimy yellow-green material that caused them to be severely hypothermic. The algal bloom, made up of the dinoflagellate (Akashiwo sanguinea), produced foam made of surfactant-like proteins that coated the birds’ feathers, with effects similar to an oil spill; this was the first documented case of its kind. A total of 550 stranded, live birds were rescued and 207 fresh, dead birds were collected over a two month period (Jessup et al. 2009). While there is no evidence that this event was linked to terrestrial sources of nutrient loading, it does illustrate that new species of HABs are occurring in MBNMS and have negative impacts on living resources.
Central Coast Ambient Monitoring Program (CCAMP)
The Central Coast Ambient Monitoring Program (CCAMP) is the Central Coast Regional Water Quality Control Board's regionally scaled water quality monitoring and evaluation program. The purpose of the program is to provide scientific information to regional board staff and the public, to protect, restore and enhance the quality of the waters of central California. More information is available on the Sanctuary Integrated Monitoring Network (SIMoN) website.
Central Coast Long-term Environmental Assessment Network (CCLEAN)
The Central Coast Long-term Environmental Assessment Network (CCLEAN) is a long-term monitoring program designed to help municipal agencies and resource managers protect the quality of nearshore marine waters in the Monterey Bay area. CCLEAN, which began in 2001, determines the sources, amounts and effects of contaminants in nearshore waters. More information is available on the Sanctuary Integrated Monitoring Network (SIMoN) website.
3. Do sanctuary waters pose risks to human health?
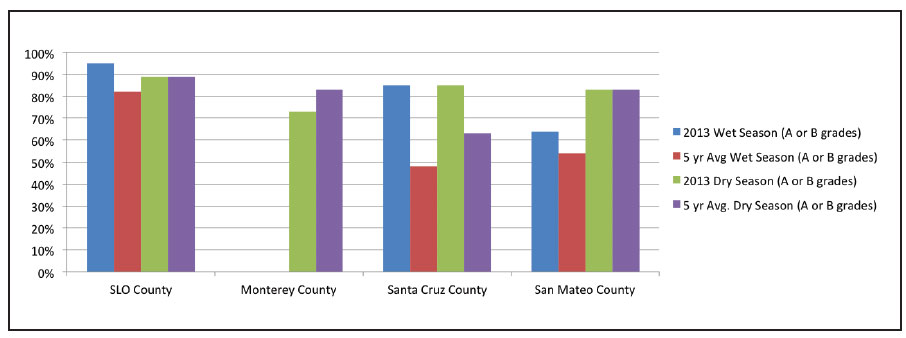
In 2009, the status and trend of risks to human health were “fair/poor” and “undetermined,” respectively. As reported in 2009, selected conditions caused or were likely to cause severe impacts to human health; however, these cases did not suggest a pervasive problem in the nearshore environment. Therefore, although there were localized areas and serious isolated impacts to human health, the majority of the sanctuary’s nearshore waters did not pose risks to humans (see 2009 MBNMS Condition Report for specifics). In 2015, the rating has been changed to “fair” because of declines in persistent organic pollutants measured in mussels and improvements to sanitary sewer infrastructure in coastal cities, as documented by a high percentage of A and B grades in the Heal the Bay Beach report card. An “undetermined” trend was based on a risk of consuming contaminated seafood and the high variability of water quality monitoring results. Again, evidence of specific human impacts did not justify widespread or persistent concern.
Indicator bacteria, such as fecal coliform, Escherichia coli (E. coli), and Enterococcus, do not usually cause illness in humans. Instead, their presence indicates the potential for water contamination with other pathogenic microorganisms, such as bacteria, viruses and protozoa, that do pose a health risk to humans (see Atwill and Carabez 2011). Figure 12 shows that three of the four counties with beaches in the sanctuary have an A or B grade at least 80% of the time when sampled during the dry weather averaged over the last five years. Please see the full report to understand the grading system (HTB 2014).
Pathogenic bacteria are of major concern for their effects on human and marine mammals. According to a report produced by FoodNet and the Centers for Disease Control and Prevention (CDC 2009), 41% of reported human bacterial infections are caused from Salmonella and 4% are caused by a strain of E. coli called E. coli 0157:H7 (note that this particular strain of E. coli is known to cause harm to humans). Over a twelve month period from April 2009 through April 2010, a study of 23 rivers, creeks and estuaries along the central coast of California were sampled 56 times to determine if Salmonella and E.coli 0157:H7 were present in those water bodies and sediment. Included in the study was an investigation to determine if there were seasonal trends and/or a correlation with fecal coliform (or E.coli) concentrations. Salmonella was detected in 31% of the water samples and 20 of the 23 sampling sites had at least one sample test positive for Salmonella. Scott Creek Lagoon, Soquel Creek and the Salinas River consistently tested negative. Salmonella in the water column was strongly associated with Salmonella in the sediment. In addition, the concentration of fecal coliform was significantly associated with the concentration of Salmonella. Approximately 2.4% of the samples tested positive for E. coli 0157:H7. Four sites tested positive one time and one site tested positive two times (Atwill and Carabez 2011). This study confirmed that human pathogens are common in central coast streams, and fecal indicator bacteria are a reasonable proxy for detecting these pathogens.
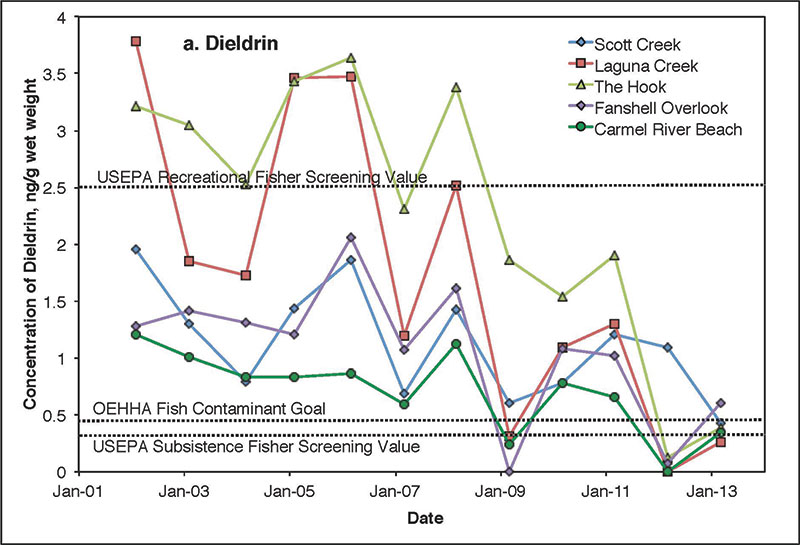
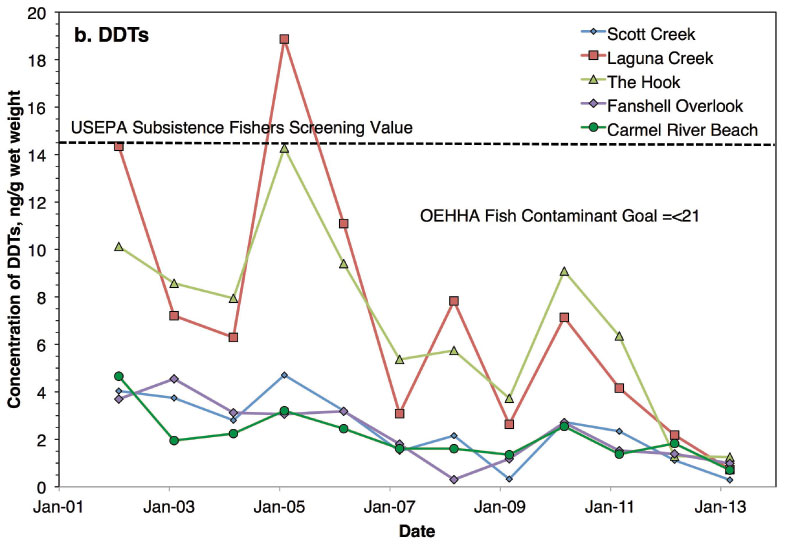
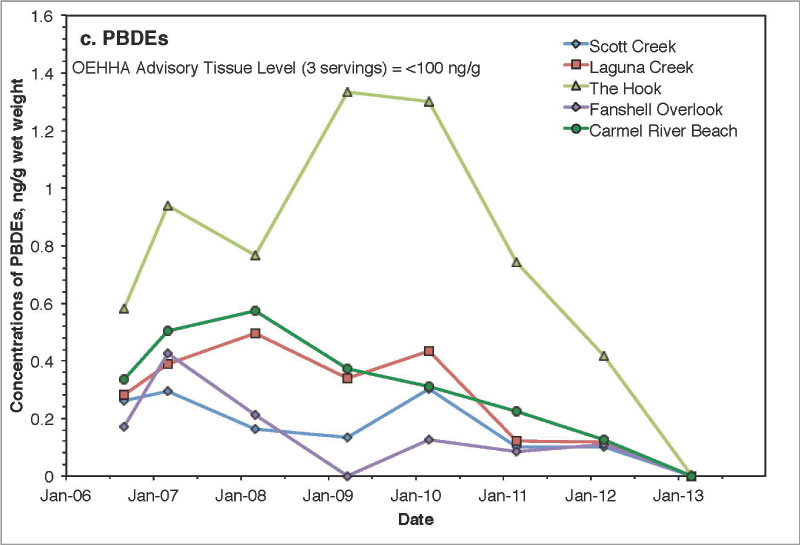
In 2007, CCLEAN reduced its mussels sampling from wet and dry seasons to just wet seasons because that was historically when the greatest concentration of persistent organic pollutants (POPs) were detected. While concentrations of some POPs continue to exceed or nearly exceed various alert levels for the protection of human health, several POPs have declined over recent years (CCLEAN 2014). Since 2008, dieldrin has remained below the U.S. EPA’s recreational fisher screening value at most sites, but concentrations remain above the U.S. EPA’s subsistence fisher screening level (Figure 13a). Significant dieldrin declines were observed at Laguna Creek, the Hook and Carmel River Beach. DDT has also declined over the past 11 years with downward trends being significant at all sites (Figure 13b). Since 2008, PBDE concentrations have generally declined in mussels, with significant declines detected at Carmel River Beach (Figure 13c) (Figure 14).
Methylmercury is the pollutant that poses the most widespread potential health concerns to consumers of fish caught in California coastal waters (Figure 15). The California Office of Environmental Health Hazard Assessment (OEHHA) No Consumption Advisory Tissue Level (ATL) of 0.44 parts per million provides an upper bound threshold for assessment of methylmercury in California sport fish. This value represents a relatively high concentration above which frequent consumption might not be safe for the most sensitive fish consumers (children and women of childbearing age). In a two year study conducted by the California Surface Water Ambient Monitoring Program, 3,483 fish representing 46 species were collected from 68 locations on the California coast. On California’s central coast near Carmel, average concentrations >0.44 parts per million methylmercury were found in gopher, rockfish (n=7) and lingcod (n=1). Similar findings were reported for lingcod (n=1) off the Cambria /Northern San Luis Obispo coast and leopard shark (n=8) in Elkhorn Slough. Eleven types of fish caught on the central coast fell within the moderate range of contamination <0.44 and >0.07 parts per million for methylmercury including black (n=12), blue (n=16), brown (n=11), gopher (n=16) and China rockfish (n=1) and cabezon (n=9) and five shark species (Davis et al. 2012). Table 1 provides POP results for central coast samples collected during this study (CCLEAN 2014). While several species from Elkhorn Slough had exceedances of subsistence fisher screening values for more than one contaminant, most species caught along the central coast did not reflect the exceedances of the Ocean Plan observed in the CCLEAN monitoring.
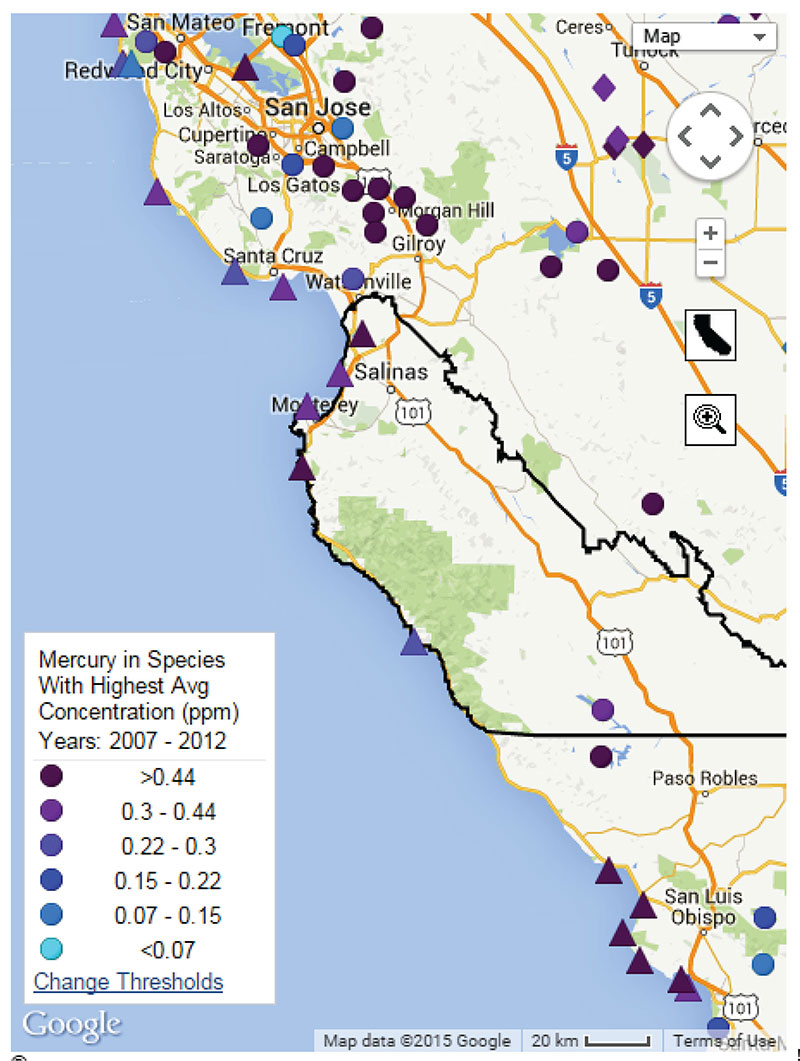
Table 1 in 2010, POP concentrations (nanogram per gram, wet weight) in fish collected along California’s central coast. Each sample consisted of a composite of filets from 4-6 fish. Values in red exceeded EPA subsistence fisher screening values (USEPA 2000). Source: Davis et al. 2012
| Station Name | Species | Sum of PCBs | Sum of DDTs | Dieldrin |
|---|---|---|---|---|
| Santa Cruz Coast Area | Black Rockfish | 0.0 | 0.92 | 0.00 |
| Santa Cruz Coast Area | Blue Rockfish | 0.0 | 1.14 | 0.00 |
| Santa Cruz Coast Area | Cabezon | 0.0 | 0.87 | 0.00 |
| Santa Cruz Coast Area | Gopher Rockfish | 0.0 | 2.29 | - |
| Santa Cruz Coast Area | Kelp Greenling | 0.3 | 3.84 | - |
| Santa Cruz Coast Area | Lingcod | 0.7 | 5.7 | 0.00 |
| Santa Cruz Coast Area | White Croaker | 0.3 | 3 | 0.00 |
| Santa Cruz Area Wharfs/Beaches | Cabezon | 0.0 | 1.3 | - |
| Santa Cruz Area Wharfs/Beaches | Gopher Rockfish | 0.2 | 1.67 | 0.00 |
| Santa Cruz Area Wharfs/Beaches | Kelp Greenling | 0.0 | 4.77 | 0.00 |
| Santa Cruz Area Wharfs/Beaches | Lingcod | 2.0 | 10.98 | - |
| Santa Cruz Area Wharfs/Beaches | White Croaker | 0.0 | 1 | 0.00 |
| Elkhorn Slough | Bat Ray | 0.5 | 3.54 | 0.89 |
| Elkhorn Slough | Leopard Shark | 3.0 | 3.87 | 0.59 |
| Elkhorn Slough | Shiner Surfperch | 4.9 | 34.37 | 0.80 |
| Elkhorn Slough | Top Smelt | 2.5 | 18.05 | 1.29 |
| Moss Landing/Marina Coast | Black and Yellow Rockfish | 0.0 | 2.4 | - |
| Moss Landing/Marina Coast | Black Rockfish | 0.0 | 0.87 | 0.00 |
| Moss Landing/Marina Coast | Brown Rockfish | 3.9 | 2.53 | 0.00 |
| Moss Landing/Marina Coast | China Rockfish | 2.8 | 1.04 | - |
| Moss Landing/Marina Coast | Gopher Rockfish | 0.5 | 2.23 | 0.00 |
| Monterey/Pacific Grove Coast | Black Rockfish | 2.7 | 4.05 | 0.00 |
| Monterey/Pacific Grove Coast | Blue Rockfish | 0.0 | 1.28 | 0.00 |
| Monterey/Pacific Grove Coast | Gohper Rockfish | 0.0 | 0.76 | 0.00 |
| Monterey/Pacific Grove Coast | Kelp Rockfish | 0.9 | 1.86 | - |
| Monterey/Pacific Grove Coast | Rainbow Surfperch | 0.2 | 3.1 | 0.00 |
| Carmel Coast | Blue Rockfish | 0.0 | 1.02 | 0.00 |
| Carmel Coast | Cabezon | 0.3 | 0 | - |
| Carmel Coast | Gopher Rockfish | 0.2 | 1.31 | 0.00 |
| Carmel Coast | Lingcod | 8.2 | 22 | - |
| Carmel Coast | Olive Rockfish | 2.5 | 3.02 | 0.00 |
| Carmel Coast | Rainbow Surfperch | 0.3 | 2.49 | 0.00 |
| Carmel Coast | Vermillion Rockfish | 0.0 | 2.07 | 0.00 |
4. What are the levels of human activities that may influence water quality and how are they changing?
In 2009, human activities detrimental to water quality conditions in the nearshore environment were rated “fair” with an “undetermined” trend, based on activities that had resulted in measurable resource impacts; however, evidence suggested these effects were localized and not widespread (see 2009 MBNMS Condition Report for specifics). The 2015 rating remains “fair,” but with an “improving” trend, based on anticipated reductions in urban and agricultural runoff in response to state regulations. In addition, Special Protections for Areas of Special Biological Significance (ASBS) are being enforced. Efforts to change human behaviors that cause pollution have strong potential to lead to an improvement in water quality. Some improvements in water quality have been observed; however, we lack data on the specific levels of human activities. Below we describe the current landscape related to population increases, reduced water availability and regulatory changes.
From April 2010- June 2013, the population in Monterey and Santa Cruz counties has increased by 3.3% (13,769 people) and 2.7% (7,043 people), respectively. This is consistent with the state of California’s population increase of 2.9% and the national increase of 2.4% over the same time period. While the population increases, construction and new development have slowed because of the limits on water availability.
On March 15, 2012, the Central Coast Regional Water Quality Control Board (CCRWQCB) adopted a Conditional Waiver of Waste Discharge Requirements (Agricultural Order No. R3-2012-0011) that applies to owners and operators of irrigated land used for commercial crop production. The CCRWQCB regulates discharges from irrigated agricultural lands to protect surface water and groundwater. The CCRWQCB is targeting priority water quality contaminants, such as pesticides, nutrients and sediments – especially nitrate impacts to drinking water sources.
The CCRWQCB also oversees a stormwater program to prevent stormwater runoff from conveying pollutants to surface waters. The stormwater program is a National Pollutant Discharge Elimination System (NPDES) program implemented in two phases based on the size of a jurisdiction (Phase I and Phase II). The City of Salinas (population greater than 155,000 in 2013) holds the only individual Phase I municipal stormwater permit in the central coast region. On March 10, 2003, coastal cities that met the definition of Phase II Regulated Small Municipal Separate Storm Sewer Systems (MS4s) were required to obtain permit coverage. It was not until February 5, 2013, that a proposed final draft of the Phase II Small MS4 General Permit was adopted; it became effective on July 1, 2013 (Order No. 2013-0001).
In addition to the agriculture and stormwater regulations, the State Water Resource Control Board (SWRCB) also took action regarding implementation of Special Protections for Areas of Special Biological Significance (ASBS). The California Ocean Plan states that: “Waste shall not be discharged to areas designated as being of special biological significance. Discharges shall be located a sufficient distance from such designated areas to assure maintenance of natural water quality conditions in these areas.” This Ocean Plan’s absolute discharge prohibition applies unless an exception is granted. On March 20, 2012, the State Water Resources Control Board adopted Resolution 2012-0012 approving exceptions to the CA Ocean Plan for selected discharges into Areas of Special Biological Significance, including special protections for beneficial uses. Currently, dischargers are developing ASBS Compliance Plans that addresses stormwater discharges (wet weather flows) and how pollutant reductions in stormwater runoff will be achieved through best management practices. At the time of this report’s publication, no monitoring results have been released, and thus, it is too soon to determine effectiveness the Special Protections’ effectiveness.
The ASBS Special Protections required reference site monitoring to establish conditions that would set natural water quality numeric values for each of the parameters measured at 28 sites along the entire California coast. All 11 of the central coast reference sites are located within the sanctuary. In 2013, preliminary results indicated that there was no toxicity at any of the sites; however, one reference site within the sanctuary reported detectable levels of anthropogenic constituents (i.e., synthetic pesticides). On average, the ocean receiving water concentrations at reference sites were comparable in pre to post-storm samples indicating that the stormwater runoff was not contributing anthropogenic pollutants to the receiving water at the reference sites. These were the first year results of the required two years of monitoring reference sites. More information is needed to confirm these results (Schiff et al. 2015).
On the central coast, multiple cities from Santa Cruz to Carmel have received state funding to build dry weather diversions, which collect urban runoff from April through November and pump it to a wastewater treatment plant. These facilities reuse the water, usually for landscape watering or groundwater replenishment, and reduce the amount of untreated water flowing to the ocean. Other examples of human activities that reduce pollutant runoff include use of drip irrigation, retention ponds/swales, nutrient management, integrated pest management and erosion control measures.
Boat marinas also do their part to reduce vessel pollution. Most marinas adjacent to MBNMS have bilge pumpouts to remove oily water from vessels. They also have sewage pumpouts that are used on a daily basis to pump sewage from vessel holding tanks to the wastewater treatment plant (ML Asst. Harbormaster, per. comm.), thereby reducing the amount of nutrients, pathogens and chemicals that enter the sanctuary. In a two year period, Moss Landing Harbor District recycled over 5,000 gallons of oily water and crankcase oil from vessels in that harbor.
With the adoption of ASBS Special Protections, the Agricultural Order and the MS4 Storm Water permits, there is much more regulatory oversight to reduce pollutant loads from these sources into the state’s surface waters. Now, the challenge is to develop a regional monitoring program designed to measure changes in nearshore water quality as a result of these regulatory requirements and management practices. Currently, each program has its own specific monitoring requirements. The limited number of samples, analytes and geographic scope reduces the confidence and statistical rigor that is needed to determine if efforts implemented are effective in improving water quality.
Nearshore Environment Water Quality Status and Trends
Status: Good Good/Fair Fair Fair/Poor Poor Undet.
Trends:
▲ Conditions appear to be improving.
- Conditions do not appear to be changing.
▼ Conditions appear to be declining.
? Undeterminted trend.
N/A Question not applicable.
| # | Issue | Rating | Confidence | Basis For Judgement | Description of Findings |
|---|---|---|---|---|---|
| 1. | Stressors | Status: N/A (not updated) Trend: N/A (not updated) |
Elevated levels of contaminants (e.g., POPs, heavy metals), nutrients, sediments, pathogens in some locations; on-going input of established and emerging pollutants. Acidification and hypoxia conditions increasing. | Selected conditions may inhibit the development of assemblages, and may cause measurable, but not severe declines in living resources and habitats. | |
| 2. | Eutrophic Condition | Status: High Trend: High |
Increasing nutrient enrichment and occurrence of HABs. New information regarding prevalence of microcystis in major river systems and coastal waters. HABs directly impacting fish, birds and mammals. | Selected conditions may inhibit the development of assemblages, and may cause measurable, but not severe declines in living resources or habitats. | |
| 3. | Human Health | Status: Very High Trend: Very High |
Continue to have warnings at some beaches and lagoons due to high fecal indicator bacteria; declining dieldrin levels in mussels, contaminated shellfish at some locations and during some seasons. Contaminants in fish exceed seafood standards at a few locations. | Selected conditions have resulted in isolated human impacts, but evidence does not justify widespread or persistent concern. | |
| 4. | Human Activities | Status: Medium Trend: Medium |
Human activities result in measurable, localized impacts. Reductions in urban and agricultural runoff anticipated in response to increased regulations for agriculture and stormwater pollution prevention. | Selected activities have resulted in measurable resource impacts, but evidence suggests effects are localized, not widespread. |
The questions with red numbers have new ratings compared to the 2009 Monterey Bay National Marine Sanctuary Condition Report (ONMS 2009).
Nearshore Environment: Habitat
The following information provides an assessment of the current status and trends of nearshore marine habitats since 2009, which include beaches, rocky intertidal, the sandy seafloor and subtidal rocky reefs and kelp forests. The bulk of current long-term monitoring occurs in rocky intertidal and subtidal rocky reefs and kelp forests; therefore, the assessments rely heavily on the status of those two habitats. More long-term monitoring is needed on the status of beaches and sandy seafloor habitats.
5. What is the abundance and distribution of major habitat types and how is it changing?
In 2009, the abundance and distribution of nearshore habitats was rated “good/fair” based on localized modification and degradation of coastal habitat, primarily through armoring of coastal bluffs and beaches, erosion of sandy shoreline and landslide disposal on rocky reefs. The trend in habitat modification was “not changing” because coastal armoring occurred at a slow pace while dams were removed in some locations. In 2015, the status has been changed to “fair” because of localized modification and loss of coastal habitat (mostly along shoreline) through landslide disposal, armoring and erosion. New information provides additional details on subtidal benthic habitat complexity, but does not change status. Also, the trend has changed to “declining” due to the continued impacts of human activities (e.g., marine debris, coastal development, sand mining) that are altering and degrading habitat, albeit at a very slow pace. The impacts of marine debris on habitat is further discussed in response to Nearshore Question 8.
New seafloor habitat maps indicate more structural complexity and variability than previously understood. The California Seafloor Mapping Program (CSMP), a collaborative program funded in 2007, has since mapped California’s state waters, including most of the nearshore environment inside the sanctuary using remote sensing, GIS and video technologies coupled with field sampling. In portions of the nearshore environment previously believed to contain fairly uniform soft bottom habitat, CSMP has found that depressed deposits of coarse-grained sediment, also called rippled scour depressions (RSDs), are more abundant and widespread than previously understood, comprising a total of 4.6% of seafloor type on the shelf in central California (Davis et al. 2013, CSMP 2012). RSDs add complexity and patchiness to relatively homogeneous, unconsolidated sedimentary substrates on the inner continental shelf. Moreover, differences have been observed in the faunal communities found inside and outside of RSDs. Hallenbeck et al. (2012) found that the densities of suspension feeders, invertebrate predators, and fishes, as well as the richness of suspension feeders and invertebrate predators, were significantly greater outside. However, young-of-the-year rockfish (Sebastes spp.) and smaller flatfish were more abundant inside RSDs, and this habitat may function as a nursery habitat for these groups.
Finescale benthic habitat mapping information is not yet available in most of the white zone in MBNMS. The white zone is the area along the immediate coastline where obstacles such as fog, high surf, rocky shoals, cloudy water and floating kelp have prevented it from being mapped with traditional technology. Currently, researchers are developing new techniques for mapping this zone and hopefully habitat data will be available in the coming years (CSMP 2012, OST and CDFW 2013).
Armoring of coastal bluffs and cliffs can alter the natural processes of erosion, sediment transport and deposition. Armoring changes the type of habitat in a given location, converting soft-sediment habitats (e.g., sandy beaches) to hard substrates (e.g., rock, cement, steel), which support very different biological communities. In 2009, we reported that an estimated 32.43 kilometers, or approximately 7%, of the sanctuary’s coastline, was armored (California Coastal Commission 2005). Since 2009, there have been ten authorizations issued by the sanctuary for new armoring and the maintenance of existing structures, primarily in Santa Cruz county (MBNMS permit database). This number of authorizations is similar to the 13 issued by the sanctuary over the previous six year period (2003-2008) which suggests that the rate of armoring has not changed substantially. However, the exact location and coastal extent of new armoring projects was not available, so we could not update our 2009 estimates of the extent of coastal armoring in the sanctuary.
Coastal sand mining in the city of Marina is the main cause of high erosion rates of beaches and adjacent dune habitat in the southern Monterey Bay (SMB) region (ESA PWA 2012). The USGS identified the SMB region as the most erosive shore on average in California (Hapke et al. 2006). The Coastal Regional Sediment Monitoring Plan (CRSMP) for southern Monterey Bay concluded that the sand mine in Marina operated by CEMEX, which bought the mine is 2000, was a primary cause of high erosion rates in SMB (PWA et al. 2008). CEMEX mines approximately 200,000 cubic yards of sand per year. It was recently estimated that cessation of this sand mining activity would reduce erosion rates by at least 60% across the entire SMB region (ESA PWA 2012). Such a cessation would slow erosion rates to natural levels, and the adverse impacts caused by mining will not continue to accumulate. Cessation of sand mining was identified as the most significant erosion mitigation measure, and thus, it should be the highest priority for all jurisdictions in the southern Monterey Bay region (ESA PWA 2012). However, a mechanism for cessation of the CEMEX commercial sand mining operation has not been identified.
Occasionally, rocky intertidal and subtidal habitat along the Big Sur coast is buried by sediment from landslide disposal; however, this activity has decreased in recent years, likely due to fewer significant winter storms. In 2011, the only new landslide disposal occurred at Alder Creek. This area was monitored for three years to evaluate any impacts to the subtidal and intertidal habitats. A full summary of the results of this study is not yet available, but preliminary results indicate that some localized impacts, such as sand accumulation and lower biodiversity, were observed in the rocky intertidal habitat just south of the slide area (Bell et al. 2015). Past study of impacts from landslide disposal activities along the central coast found impacts to be localized, and strongly dependent on the type of nearshore habitats (rocky vs. sandy) present at, and immediately adjacent to, the site of the slide (Oliver et al. 1998).
Long-term Monitoring Program and Experiential Training for Students (LiMPETS)
LiMPETS (Long-term Monitoring Program and Experiential Training for Students) is an environmental monitoring and education program for students, educators and volunteer groups. This hands-on program was developed to monitor the coastal ecosystems of California’s national marine sanctuaries to increase awareness and stewardship of these important areas. Two distinct monitoring programs make up the core of the network: (1.) the Rocky Intertidal Monitoring Program and (2.) the Sandy Beach Monitoring Program. Approximately 5,500 teachers and students are involved with the collection of data as part of the LiMPETS network.
6. What is the condition of biologically-structured habitats and how is it changing?
Data from the last five years on the condition of biologically-structured habitats in the nearshore environment indicates that, similar to the assessment in 2009, these resources are in “good” condition with a “not changing” trend. A number of on-going monitoring studies in the rocky intertidal and kelp forest habitats indicate that a variety of ecologically important structure-forming species appear to be healthy and no major perturbations have been observed. No data is available on the condition and recent trend for biogenic species on the sandy seafloor.
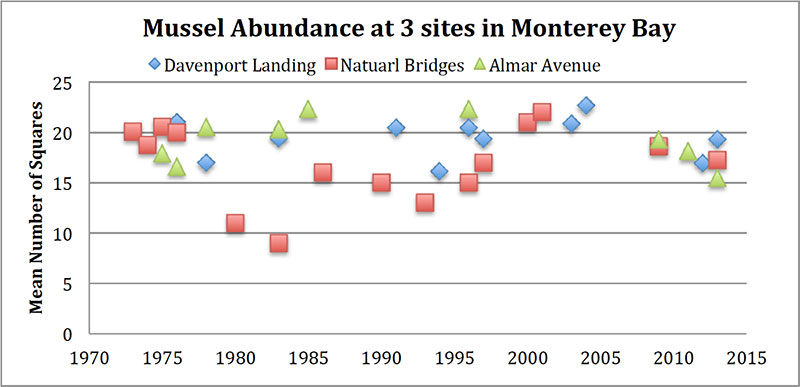
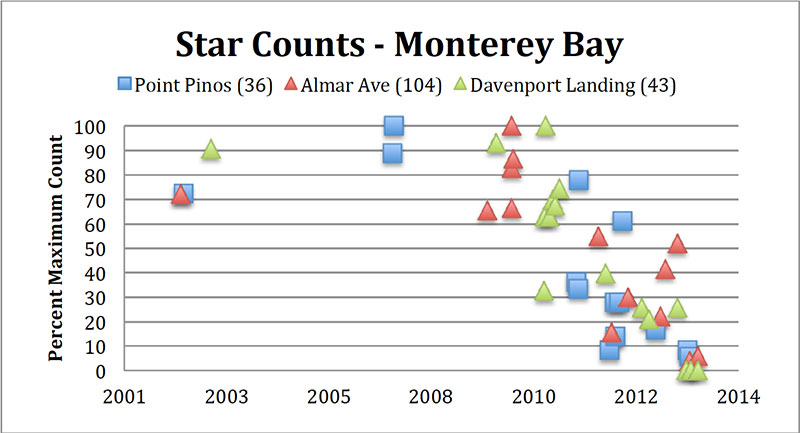
In the rocky intertidal habitat, mussels (Mytilus californianus) are an important structure-forming species in the mid zone. The on-going monitoring by LiMPETS (Long-term Monitoring Program and Experiential Training for Students) of mussels abundance on intertidal platforms at Davenport Landing, Natural Bridges and Almar Avenue shows quite a bit of stability over the last 40 years with recent mussel abundances (2009-present) being similar to the long-term average (Figure16) (J. Pearse, unpubl. data). The abundance of mussels has been reduced at some locations due to repeated harvests for human consumption (P. Raimondi, PISCO/MARINe, pers. comm.). Locations with higher levels of recreational tidepooling activity can have lower coverage of some types (Tenera Environmental 2003). Nonetheless, the sites with reduced abundance from trampling and harvest comprise a small percentage of habitat in the entire nearshore environment.
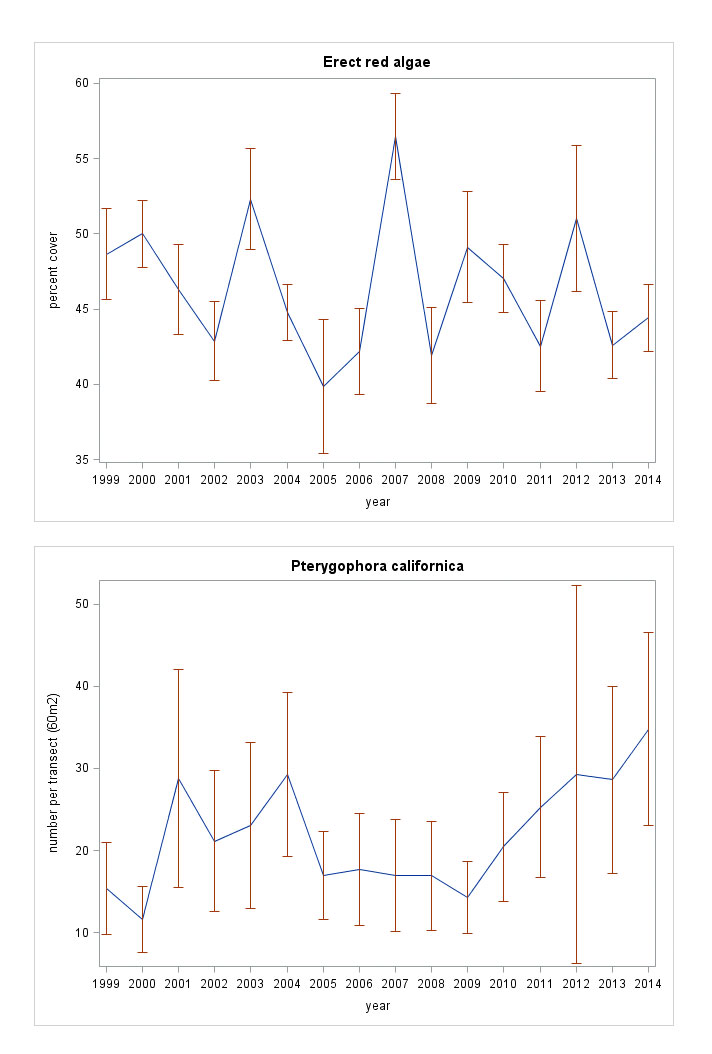
Kelp beds persist from year to year, but the extent of kelp beds does exhibit seasonal and annual variation. For instance, the extent of giant kelp (Macrocystis pyrifera) off central California ranges from a low of 6.5 square kilometers to a high of 47 square kilometers (OST and CDFW 2013). The amount of giant kelp canopy along the central California coast, calculated from Landsat satellite images, shows that, since 2009, kelp canopy has fluctuated within the range that is expected based on a longer time series that started in 1984 (Figure 17) (P. Raimondi, PISCO/MARINe, unpubl. data). The abundance of two other important structure-forming groups in kelp forests, the understory kelp (Pterygophora californica) and erect red algae, also appears to be in good and stable condition based on long-term monitoring by the Partnership for Interdisciplinary Studies of Coastal Oceans (PISCO) (Figure 18) (M. Carr, PISCO, unpubl. data). Reef Check California (RCCA) observed similar trends in the density of giant kelp and Pterygophora (J. Freiwald, RCCA, unpubl. data). RCCA is a citizen science group composed of SCUBA divers that have been monitoring kelp forests at 17 sites in MBNMS since 2006.
Source: P. Raimondi, PISCO/MARINe, unpubl. data
Looking forward, some recent events could result in substantial changes in the abundance of nearshore structure-forming species. Starting in 2014, sea surface temperatures have been anomalously high all along the U.S. West Coast. Moreover, some indicators suggest that the Pacific Decadal Oscillation shifted from conditions that promote high primary productivity (observed in 2008-2013) to less productive conditions in 2014 (see response to Offshore Question 1 for more details). If these less productive conditions, or anomalously high temperatures, persist in the region, they could result in declines in abundance of canopy-forming kelp and understory algae. Also, abundance of kelp and understory algae may be negatively impacted by the recently observed increase in abundance of red and purple sea urchins, which consume kelp and understory algae (see Figure 31). In 2014, this increase in sea urchins began concurrently with a dramatic reduction in the abundance of some sea star species, such as the ochre star (see Figure 29). Ochre stars’ predation of mussels limits the mussels’ abundance in the lower intertidal zone. The absence of ochre star predation may allow mussel beds to expand their lower limit, which could result in an increase their overall abundance at some locations (S. Lonhart, MBNMS, pers. comm.). On-going monitoring efforts in the sanctuary, including Multi-Agency Rocky Intertidal Network (MARINe), PISCO, RCCA and LiMPETS, will be the key to track these potential changes in the status and condition of structure-forming species in nearshore habitats.
Partnership for Interdisciplinary Studies of Coastal Oceans (PISCO)
PISCO is a long-term monitoring and research program designed to understand the dynamics of the West Coast’s ocean ecosystem. In 1999, PISCO began a large-scale, long-term study of the patterns of species diversity in rocky shore and kelp forest habitats and the physical and ecological processes responsible for structuring these communities. PISCO is led by scientists from core campuses: Oregon State University (OSU); Stanford University’s Hopkins Marine Station, University of California, Santa Cruz (UCSC) and University of California, Santa Barbara (UCSB).
Reef Check California (RCCA)
Reef Check California (RCCA) is a network of trained volunteers who carry out surveys of nearshore reefs that provide data on the status of key indicator species. RCCA’s goal is to support the sustainable use and conservation of our nearshore marine resources.
7. What are the contaminant concentrations in sanctuary habitats and how are they changing?
In 2009, the condition of nearshore habitats was rated "fair" and "declining" due to elevated contaminants at locations near urban, maritime or agricultural activities and the continued input of contaminants into coastal waters from point and non-point sources (see 2009 report for specifics). The 2015 rating has been downgraded to "fair/poor" with a "declining" trend based on new contaminants detected, contaminants that exceed regulatory objectives and evidence of the accumulation of contaminants in sea otters, shellfish and resident fish that have caused or are likely to cause severe declines in some but not all living resources or water quality.
Throughout the nearshore environment water quality section, we have provided examples of land-based contaminants detected in the water column, sediment, flora and fauna. While some of the contaminants that were a concern in 2009 have decreasing concentrations, such as dieldrin, DDT and PBDEs found in mussels at five sites around Monterey Bay (see Figures 13 a, b and c) and a detailed discussion in response to Nearshore Question 3), other legacy POPs, such as PCBs and polycyclic aromatic hydrocarbons (PAHs), remain in the water and sediment at levels of concern for marine organisms. A recently published study found that sea otters from three sites in Monterey Bay (Santa Cruz, Elkhorn Slough and Monterey) had mean POP levels 5-20 times higher than sea otters from locations in Alaska (Jessup et al. 2010). In particular, sea otters from Santa Cruz had high levels of both PCBs and DDT (see Offshore Question 7 for more information on PCBs in marine mammals).
New current-use pesticides have been detected in the tissues of marine and estuarine organisms in central California. In a study by Smalling et al. (2013), current use pesticides (CUPs) and legacy pesticides (DDT) were studied to determine their presence in water, sediment and the tissues of sand crabs (Emerita analoga), starry flounder (Platichthys stellatus) and staghorn sculpin (Leptocottus armatus) in a coastal estuary. This was the first study to document the occurrence of CUPs in the tissues of marine organisms. Water samples were analyzed for a suite of 68 CUPs; 24 were detected including six fungicides, eight herbicides, five insecticides and five pesticide degradates. Sediment was analyzed for 34 fungicides and 57 CUPs; 22 were detected, including four fungicides, seven herbicides, seven insecticides and four pesticide degradates. Fish and crab tissue samples were analyzed for 98 CUPs; 13 CUPs and DDT were detected in the fish tissue. Total DDT concentrations were an order of magnitude higher than individual CUPs in the fish tissue. Ten contaminants, including three fungicides, four insecticides and DDT, DDD and DDE were detected in the sand crab tissue. Many of the most frequently detected compounds in the fish and crab tissues were typically observed in the water and sediment samples, with the exception of pyrethroids, which were present in both sediment and tissue but at non-correlated concentrations (Smalling et al. 2013).
As described in the response to Nearshore Question 2, microcystin toxicity has become a serious threat in the last five years. A 2010 study surveyed 21 freshwater, estuarine and marine locations using Solid Phase Adsorption Toxin Tracking (SPATT) samplers (Kudela 2011) at the land-sea interface to determine the presence and concentration of microcystin. Fifteen of 21 sites were positive for microcystin toxin. These blooms are common in freshwater systems throughout California; however, it was not until recently that we now understand the widespread occurrence of toxic blooms at low to moderate levels in the marine environment throughout the year. Coastal nutrient loadings were statistically significant predictors of the microcystin concentrations with clear evidence for seasonality at some sites (Gibble and Kudela 2014). As described in the nearshore water quality section, microcystin was determined to have poisoned 11 southern sea otters in 2007.
8. What are the levels of human activities that may influence habitat quality and how are they changing?
In 2009 the level of human activities that influence habitat quality in the nearshore environment was rated“good/fair” because some human activities had substantial, localized negative impacts on habitat quality. The trend was “undetermined” due to a lack of information for many of the activities and uncertainty regarding how to combine the available information into a cumulative trend. Based on new information, the status was changed to “fair” because some on-going activities have substantial, localized negative impacts on habitat quality (e.g., coastal armoring, coastal development, sand mining) and some activities (e.g., release of contaminants and marine debris) are more widespread, although there are efforts to reduce said impacts (beach clean-ups, management of contaminant sources). Based on new information, the status was changed to “fair” because some on-going activities have substantial, localized negative impacts on habitat quality (e.g., coastal armoring, coastal development, sand mining) and some activities (e.g., release of contaminants and marine debris) are more widespread, although there are efforts to reduce said impacts (beach clean-ups, management of contaminant sources).
The 2015 trend remains “undetermined” due to uncertainty in how to combine the available information into a cumulative trend. Some activities with negative impacts, like sand mining, coastal armoring, dredging and landslide disposal, continue at rates similar to the last assessment period (see Nearshore Question 5 for more details). Human visits to the shoreline are increasing, which could lead to increasing impacts to the intertidal habitat. Contaminants and marine debris are present and likely accumulating, but at an unknown rate. Conversely, some activities may offset negative impacts (coastal clean-ups, management of contaminant sources and implementation of best management practices).
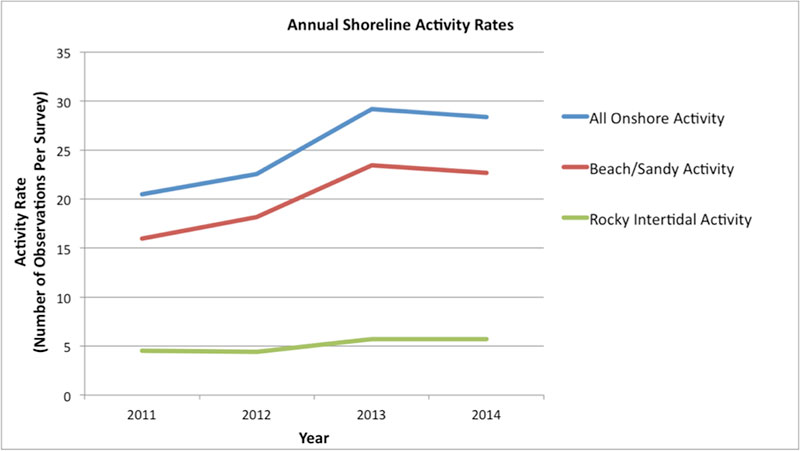
Beaches and rocky shores with roads and parking lots can receive a high level of visitors, especially at sites near population centers. In the rocky intertidal zone, people may negatively impact the habitat by trampling animals or algae, or by collecting structure-forming organisms and turning over rocks and boulders. At beaches, visitors may negatively impact habitat quality by littering or causing disturbance of critical habitat for sensitive species, such as the western snowy plover. In 2011, the Otter Project began training volunteers to survey human activities along the central California coast at beaches and accessible rocky shores in a citizen science program called MPA Watch (marine protected area). The types of activities they record include both extractive (hand collection, line-fishing) and non-extractive (tidepooling, wildlife watching, playing) activities. Based on the first four years of survey data, the average amount of shoreline activities observed increased from 2011 to 2013, and then remained similar between 2013 and 2014 (Figure 19). The increase in shoreline activity rates occurred at both beaches and rocky shores (J. Natov, Otter Project, unpubl. data).
A variety of land-based and water based human activities result in the introduction of contaminants, including pesticides, microbial contaminants and plastic debris, into the nearshore habitats. The leading sources of contamination in the sanctuary are agricultural and urban runoff (see response to Nearshore Question 7 for detailed information). A recent study of the types of litter on Monterey Bay’s beaches found that small pieces of styrofoam (5 millimeters- 5 centimeters in size) and fragmented plastics (2 millimeters -2 centimeters) were the two most common types of litter (Rosevelt et al. 2013). Both items are persistent in the environment and a hazard for animals foraging in nearshore habitats (Arthur et al. 2009, Donnelly-Greenane et al. 2014, Nevins et al. 2014, NOAA-MDP 2014). The deposition of styrofoam, fertilizer pellets and fragmented plastics was highest in winter and central bay locations, especially after storm events, which may indicate transport of debris by rivers. The fertilizer pellet casings are the remains of time-release fertilizer applications on land uses, such as agriculture or nurseries.
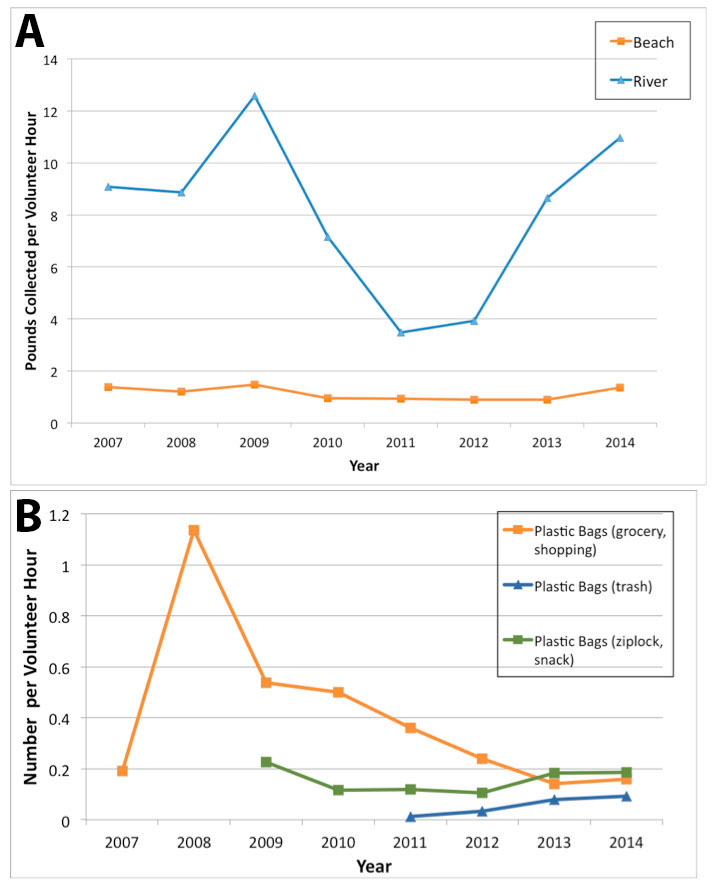
Since 2007, Save Our Shores (SOS), a non-profit marine conservation organization in Santa Cruz, has led 1,886 beach and river clean-ups in Santa Cruz and Monterey counties. Currently, they host monthly clean-ups at 53 beaches on Monterey Bay and less frequent clean-ups on the San Lorenzo River, Elkhorn Slough and several other creeks in Santa Cruz County. Despite SOS’s efforts, trash continues to be found and removed from both beaches and rivers. Volunteers at beaches collect smaller loads of trash per hour than volunteers in rivers (Figure 20a), which may be due to the fact that volunteers at the less frequent river clean-ups encounter more and larger trash. It appears that more river clean-up could substantially reduce inputs of trash to the sanctuary (B. Patterson, SOS, unpubl. data). The number of plastic grocery bags found per hour has declined every year since 2008, while the number of other types of plastic bags has not declined (Figure 20b). This decline may be due in part to plastic grocery bag bans in local communities, including Santa Cruz (2011) and Monterey (2014) counties.
The pressures discussed are likely to increase with continued coastal development and population growth. Management programs at the local, regional and state levels attempt to reduce negative impacts, but it is unknown whether these programs will be able to offset the increasing pressure of development and population growth on sanctuary habitats. In particular, production of desalinated water has the potential to increase substantially over the next few years, especially given the severe drought in California (see Droughts in California text box). There are a variety of concerns associated with desalination facilities, including additional coastal development, significant volumes of greenhouse gas emissions from the energy intensive desalination process and construction of new pipelines that can disturb the seafloor, surf zone and dunes, and potentially change coastal hydrology (NOAA 2010). As of early 2015, there are multiple desalination facilities being considered within the sanctuary, with all but one located in Monterey Bay. In March 2015, the first new project completed a test well to study the effectiveness of a sub-surface well intake to minimize negative impacts on sanctuary resources.
Nearshore Environment Habitat Status and Trends
Status: Good Good/Fair Fair Fair/Poor Poor Undet.
Trends:
▲ Conditions appear to be improving.
- Conditions do not appear to be changing.
▼ Conditions appear to be declining.
? Undeterminted trend.
N/A Question not applicable.
| # | Issue | Rating | Confidence | Basis For Judgement | Description of Findings |
|---|---|---|---|---|---|
| 5. | Abundance/ Distribution |
Status: Very High Trend: Very High |
Localized modification of coastal habitat and reduced habitat quality, primarily through armoring, erosion, landslide and accumulation of marine debris and contaminants. | Selected habitat loss or alteration may inhibit the development of assemblages, and may cause measurable, but not severe declines in living resources or water quality. | |
| 6. | Biologically- Structured |

|
Status: Very High Trend: Very High |
Monitoring programs indicate healthy populations and no major perturbations. | Habitats are in pristine or near-pristine condition and are unlikely to preclude full community development. |
| 7. | Contaminants | Status: High Trend: High |
Declines in some persistent contaminants (dieldrin), but new contaminants being added to the system; some evidence showing contaminants are accumulating in shellfish and resident fish and are impacting health of living resources (e.g., mammals). | Selected contaminants have caused or are likely to cause severe declines in some, but not all living resources or water quality. | |
| 8. | Human Impacts | Status: Medium Trend: Medium |
Trampling, visitation and coastal armoring can have measurable, localized impacts; trash and contaminants present and accumulating slowly despite management efforts. | Selected activities have resulted in measurable habitat impacts, but evidence suggests effects are localized, not widespread. |
The questions with red numbers have new ratings compared to the 2009 Monterey Bay National Marine Sanctuary Condition Report (ONMS 2009).
Nearshore Environment: Living Resources
Biodiversity is variation of life at all levels of biological organization, and commonly encompasses diversity within a species (genetic diversity) and among species (species diversity), and comparative diversity among ecosystems (ecosystem diversity). Biodiversity can be measured in many ways. The simplest measure is to count the number of species found in a certain area at a specified time; this is termed species richness. Other indices of biodiversity couple species richness with a relative abundance to provide a measure of evenness and heterogeneity. When discussing biodiversity we primarily refer to species richness and diversity indices that include relative abundance of different species and taxonomic groups. To our knowledge, no species have become extinct within the sanctuary; therefore, native species richness remains unchanged since sanctuary designation in 1992. Researchers have described previously unknown species (i.e., new to science) in deeper waters, but these species existed within the sanctuary prior to their discovery. The number of non-indigenous species has increased within the sanctuary; however, we do not include non-indigenous species in our estimates of native biodiversity.
Key species, such as keystone species, indicators species, sensitive species and those targeted for special protection, are discussed in the responses to questions 12 and 13. Status of key species will be addressed in question 12 and refers primarily to population numbers. Condition or health of key species will be addressed in question 13. The sanctuary’s key species are numerous and all cannot be covered here. Instead, in this report, we emphasize examples from the sanctuary’s primary habitats with data available on status and/or condition.
The following information provides an assessment of the status and trends since 2009 that pertain to the current state of the sanctuary’s living resources in the nearshore environment, This section is based on studies of faunal communities in the sandy and rocky intertidal and the sandy and rocky subtidal habitats. Much more research occurs in rocky intertidal and subtidal rocky reef and kelp forests; therefore, the assessments are primarily based on the status of living resources in these two habitats. More research and long-term monitoring is needed on the status and trends of faunal communities associated with beaches and sandy seafloor habitats.
9. What is the status of biodiversity and how is it changing?
Native species richness in the sanctuary’s nearshore habitats has been unchanged over the last few decades with no known local extinctions of native species. Nonetheless, the relative abundance of native species in the intertidal and nearshore subtidal zones has been altered by a variety of factors, including human activities, such as trampling and harvest. The recent implementation of many marine reserves and conservation areas in California’s state waters may facilitate recovery of reduced populations in those locations. Based on these patterns in 2009, the status of native biodiversity in the nearshore environment of the sanctuary was rated “fair,” but the overall trend in biodiversity was “undetermined.”
On-going monitoring in rocky intertidal and subtidal reef habitats provides new information to further characterize patterns in community composition in nearshore habitats and examine trends in abundance of key species and assemblages. We are only aware of one substantial change to nearshore biodiversity: a recent dramatic decline in sea stars and concurrent increase in sea urchins (see response to Nearshore Questions 12 and 13 for details). This occurred very recently and we need more time to determine whether it will persist and cause, or be likely to cause, severe declines in other ecosystem components (which would be consistent with a fair/poor rating). Therefore, the status for 2015 remains “fair.” The trend is “not changing” due to the apparent stability of most components of the rocky shore and kelp forest assemblages.
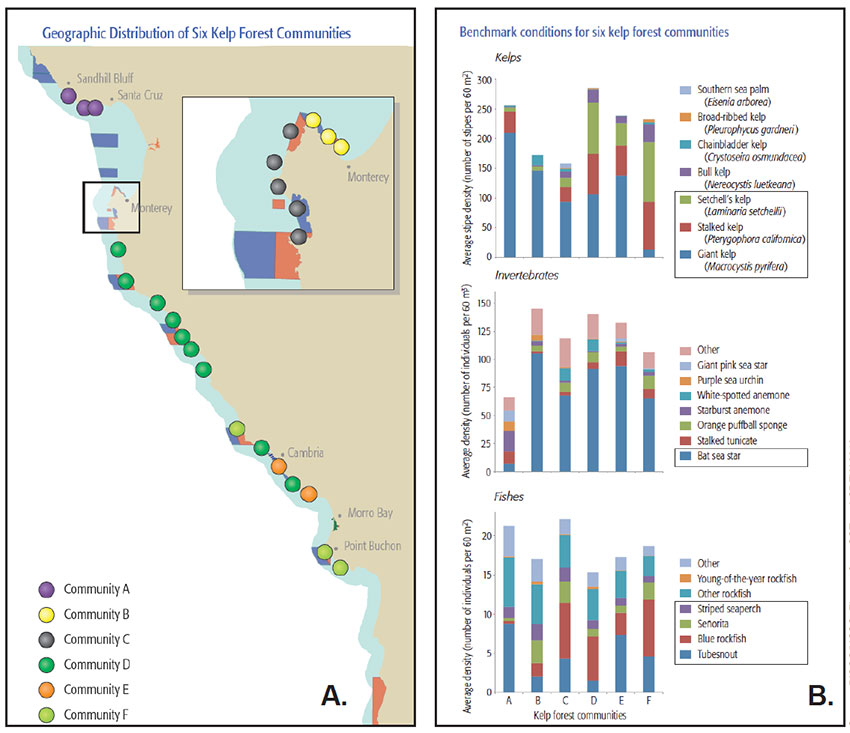
The sanctuary’s rocky intertidal community is biologically rich, with 567 native species documented in surveys of the more conspicuous species (Wasson et al. 2005). The Partnership for Interdisciplinary Studies of Coastal Oceans (PISCO) and Multi-Agency Rocky Intertidal Network (MARINe) collect long-term monitoring data from 26 sites in the central California’s rocky intertidal habitat. ,An analysis of the percent of available space occupied by certain types of invertebrates, marine plants and algae, and physical substrate, identified six distinct communities (Figure 21) (summarized in OST and CDFW 2013). These patterns of relative abundance and diversity of species in the rocky intertidal habitat appear to be strongly influenced by physical features, including swell and wave exposure, rock roughness, substrate slope, and water temperature. For example, sites with communities 3 and 4 experience higher swell and wave exposure than sites with communities 1, 2, 5 and 6 (OST and CDFW 2013). Although community 6 was not observed inside MBNMS, it may occur in the sanctuary at sites with similar physical attributes. The level of human activities, such as harvest or trampling, can also affect the relative abundance and diversity at a given location; however, specific information on trends in biodiversity and the relative importance of changes in physical factors and human use patterns are not currently available.

PISCO also collected long-term monitoring data from 25 kelp forests in central California. PISCO identified six distinct communities that can be differentiated based on the relative density of canopy and understory kelps and certain species of invertebrates and fishes (Figure 22) (summarized in OST and CDFW 2013). The type and relief of the substrate was found to strongly influence abundance and diversity of kelp forest communities. For example, community A was found in areas dominated by bedrock with flat relief, community C was associated with habitats with more moderate and high relief than the others and community E was found in habitats with the most boulder and cobble substrates (OST and CDFW 2013). Though Community E was not observed inside MBNMS, it may occur in the sanctuary at sites with similar physical attributes.
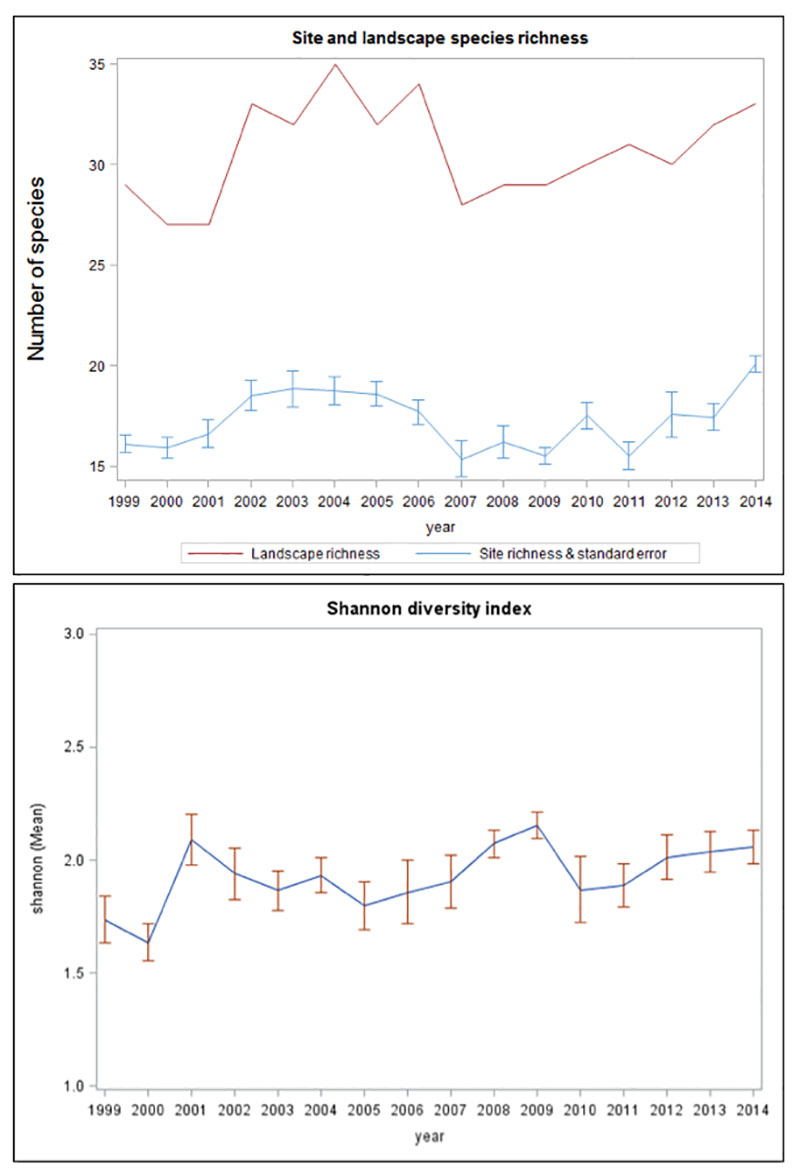
Lastly, PISCO’s long-term monitoring data for kelp forest fishes at 12 sites in the sanctuary provides some information on trends in diversity of the nearshore fish assemblage (Figure 23). Species richness and diversity of the kelp forest fish assemblage in the sanctuary varies over time, likely influenced by multiple factors, including changing ocean conditions. However, there were no obviously strong influences of ocean conditions on kelp forest fish diversity, and diversity appears to be fairly stable from 1999-2014.
Less is known about biodiversity patterns in the sanctuary’s sandy bottom habitats. Some observed changes in biodiversity in the soft bottom habitats of the nearshore environment are likely in response to large-scale, long-term climatic shifts (e.g., Pacific Decadal Oscillation), but data detecting this pattern are limited to a small area (MLML 2006). Additional long-term monitoring data would be useful to further explore status and trends in this faunal community.
As discussed above, patterns in biodiversity in rocky shore and kelp forest communities are strongly influenced by physical factors. Changes in physical factors driven by global climate change will influence the sanctuary’s patterns of biodiversity. Warming of air temperature should lead to ocean warming, which will lead to changes in species distribution along the north-south coastline of MBNMS. A subset of the species that occur in the sanctuary are “southern” species, whose range extends only into the southern or central portions of MBNMS. Some other species are “northern” species, whose range only extends into the northern or central portions of the sanctuary. As ocean temperatures warm, we would expect to see the range of some southern species expand northward while the range of some northern species contracts. Sagarin et al. (1999) found some evidence that the ranges of some southern species were expanding northward along the California coast. We are not aware of any new examples of range expansions and contractions of nearshore species in the sanctuary due to climate warming, but we expect this to be a future driver of change in nearshore biodiversity.
Multi-Agency Rocky Intertidal Network (MARINe)
The Multi-Agency Rocky Intertidal Network (MARINe) is a partnership of agencies, universities and private groups committed to determine the health of the rocky intertidal habitat along North America’s west coast and providie this information to the public. MARINe monitors over 100 coastal sites and many of the sites have been monitored for periods of 15 to over 25 years. MARINe represents the largest program of its kind.
10. What is the status of environmentally sustainable fishing and how is it changing?
We no longer assess this question in ONMS condition reports; therefore, content for this question was not updated.
11. What is the status of non-indigenous species and how is it changing?
In the 2009 report, the status of non-indigenous species (NIS) was rated “good” with a “declining trend” because some NIS were identified in the sanctuary’s nearshore habitat and a few of those species appeared to have spread. Surveys in sandy and rocky intertidal and subtidal habitats detected NIS in all habitat types, but the percentage of NIS was low (1-2%) (Wasson et al. 2005, Maloney et al. 2006). The 2015 status remains “good” with a “declining” trend because new information on NIS in the sanctuary’s nearshore habitats is consistent with 2009’s basis for judgment.
NIS (e.g., Caulacanthus ustulatus, Endocladia muricata. Sargassum muticum, Colpomenia spp. Hymeniacidon, Sargassum muticum) continue to be observed at low abundance levels by monitoring programs in the sanctuary’s nearshore habitats and we are not aware of evidence of strong ecological impacts from these species (P. Raimondi, PISCO/MARINe, pers. comm., Zabin et al. unpubl. data). Recent surveys in Moss Landing and Monterey Harbors by California’s Marine Invasive Species Program found that the percentage of NIS was low (<2%) (CDFW 2014), which is consistent with the past studies noted above. One species of concern, the Asian kelp (Undaria pinnatifida), continues to be abundant in Monterey Harbor, but has not spread outside the harbor (S. Lonhart, MBNMS, pers. comm.) . A second species of concern, the Japanese bryozoan (Watersipora subtorquata), shows patterns of slowly spreading away from Monterey Harbor along the rocky intertidal and subtidal habitats of the Monterey peninsula.
In 2009, we reported that surveys had documented the spread of Watersipora from Monterey Harbor to the open coast at the Hopkins Marine Life Refuge. (S. Lonhart, MBNMS, unpubl. data). Surveys in October 2014 recorded Watersipora from four subtidal sites (Breakwater Cove, McAbee Beach, Hopkins Marine Station and Lovers Point) and from three intertidal sites (Breakwater Cove, McAbee Beach, and Hopkins Marine Station) along the Monterey peninsula, but it was not found at the survey sites furthest away from the harbor on the peninsula (Coral Street) or in Carmel Bay. The colonies observed were typically small, representing between 0.1-2.5% cover across study transects, but were widely distributed within transects in some locations (i.e., found in 23% of quadrats at Breakwater Cove and 10% of quadrats at McAbee Beach). The bryozoan was attached to a wide variety of substrates, including rock, barnacles, algae and crabs. It was found on both horizontal and vertical surfaces subtidally, but appears to be limited to vertical surfaces in the intertidal zone.
12. What is the status of key species and how is it changing?
In 2009, the status of key species in the nearshore environment was rated “good/fair” and the trend was “not changing” because of the reduced abundance of a limited number of key species in each habitat type. Although monitoring data indicates that many key species are stable or increasing, the 2015 status is changed to “fair” and “declining” because of the recent, significant changes in the abundance of sea stars and sea urchins. Both sea stars and sea urchins can influence ecological structure and function of rocky reef and kelp forest habitats, and this dramatic change in their relative abundance may have measurable impacts to ecosystem integrity in the nearshore environment.
Below we briefly provide updated information on the status of a number of key species that play important ecological roles in the nearshore ecosystem.
Key species in the rocky intertidal habitat include sea stars, black abalone, owl limpets, surf grass, mussels, algae and black oystercatchers. In the response to Nearshore Question 6, we reported that the status of the habitat-forming species (e.g., mussels, surf grass, algae) is generally good and stable sanctuary-wide, but show reduced abundance at some sites because of high levels of human impacts (trampling, harvest) (PISCO/MARINe, unpubl. monitoring data). As was reported in 2009, disease (i.e., withering syndrome) severely reduced black abalone abundance in the southern portion of the sanctuary (i.e., south of Pt. Sierra Nevada); over-harvesting and predation reduced abundance in the rest of the sanctuary, but disease was not prevalent (ONMS 2009). Since 2009, abundance has not changed substantially at any sites in the sanctuary (P. Raimondi, PISCO/MARINe, pers. comm.).
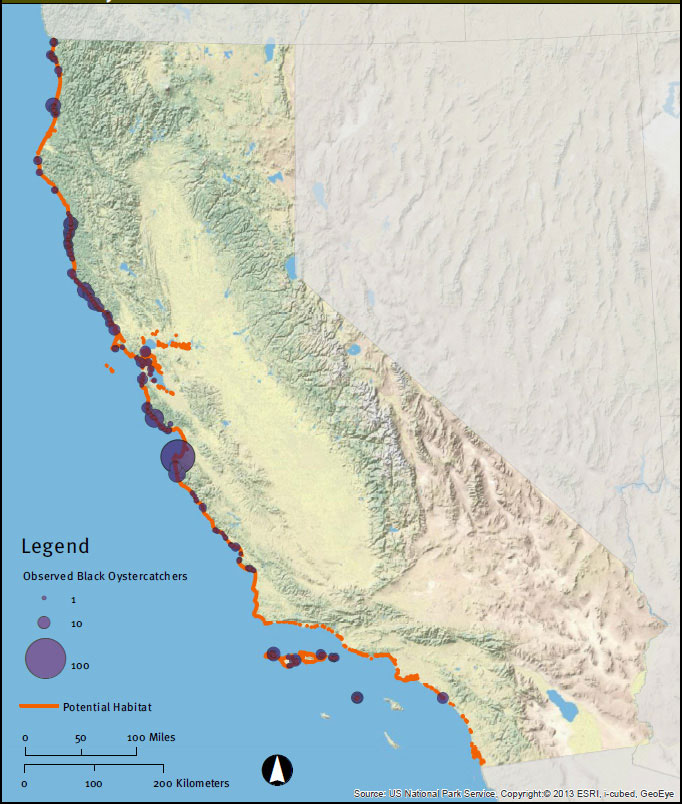
In 2011, the California population of black oystercatcher (Haematopus bachmani) was assessed for the first time during the early breeding season when observers surveyed approximately 18% of the state’s mainland suitable habitat (Weinstein et. al. 2014). Density of individuals in mainland survey areas averaged 3.14 birds per kilometer, but were quite variable across survey sites with high densities observed at some locations in MBNMS (Figure 24). Analysis of Audubon’s Christmas Bird Count (CBC) data suggests that the California population has been increasing slightly in recent years (2007–2011) (Weinstein et al. 2014).
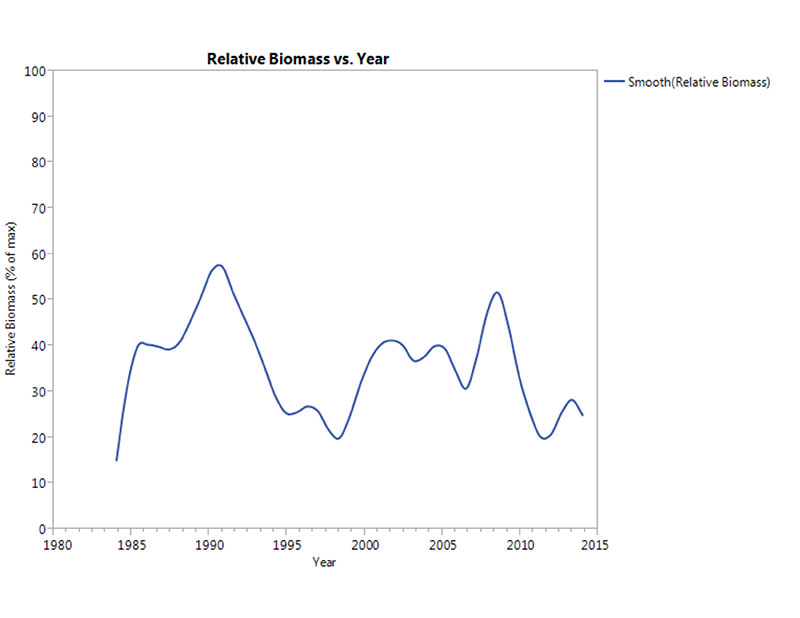
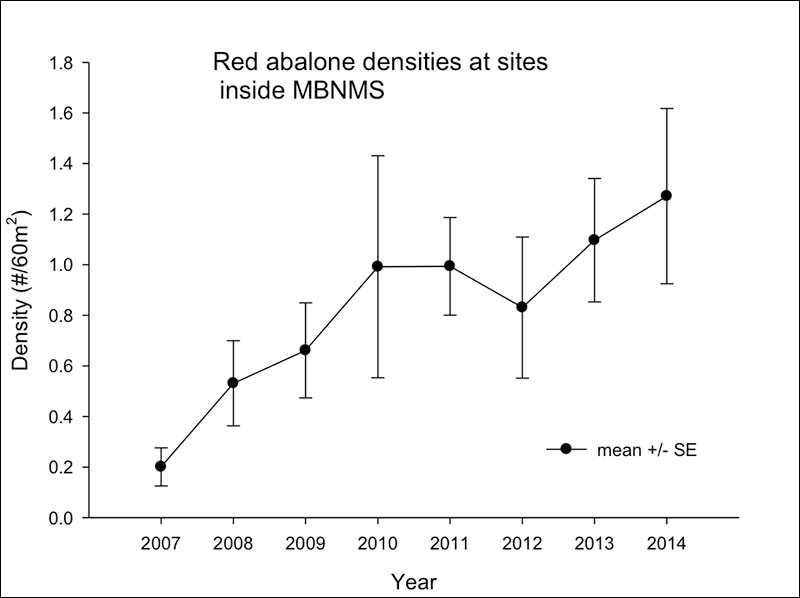
PISCO, Reef Check California (RCCA) and sanctuary staff monitor the kelp forest community at many sites in MBNMS. In the response to Nearshore Question 6, we reported that the status of some key structure-forming species (e.g., canopy-forming kelp and understory algae) is generally good and stable sanctuary-wide. Another key kelp forest species, the red abalone (Haliotis rufescens), appears to be increasing in abundance (Jan Freiwald, RCCA, unpubl. data). Since 2007, when RCCA began monitoring red abalone density at 16 sites in the sanctuary, average density has slowly increased from 0.2 to 1.3 abalone per transect (60 square meters) (Figure 25).
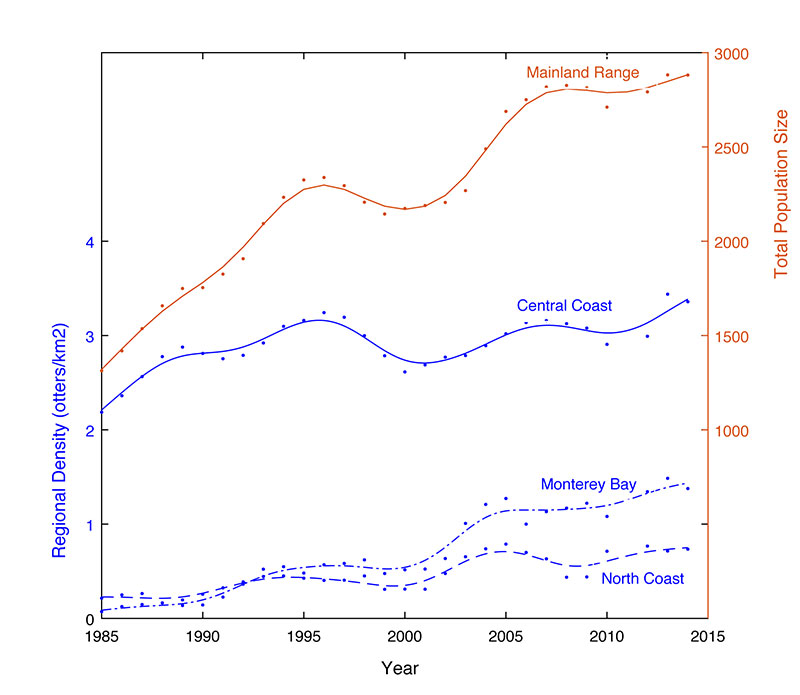
Sea otters are considered a keystone species of the kelp forest ecosystem because they are highly effective predators capable of limiting herbivorous invertebrate (e.g., sea urchins) populations, that if otherwise left unchecked, can decimate kelp beds and the associated community of fish and invertebrates. Since the 1980s, USGS scientists have calculated a population index each year for the southern sea otter (Enhydra lutris nereis). In 2014, the population index was 2,944, which continues the gradual increase observed since 2010 (Figure 28). The population of sea otters in the sanctuary is composed of three regions with different demographic patterns: (1.) the north coast region (extending from Santa Cruz northward) is stable or slowly growing, with further growth and range expansion limited primarily by deaths attributable to non-consumptive shark bites, which have increased sharply in the last five years; (2.) the Monterey Bay region (Santa Cruz to Monterey, but excluding Elkhorn Slough) is growing slowly because it is comprised of mostly non-reproducing individuals (transient males and subadult females) and has higher rates of mortality due to water quality issues, and more recently by increased rate of shark bites; and (3.) the central coast region (extending from Monterey south to Cambria) has shown variable growth rates from year to year, but over the last decade has been more or less stable because it is at or near carrying capacity, and in the last 5-10 years, there has also been a significant increase in shark bite mortality near Cambria (T. Tinker, USGS-WERC, pers. comm.). Although the demographics in the three regions are quite different, the population trend of otters in all three regions is stable or weakly positive (Figure 28).
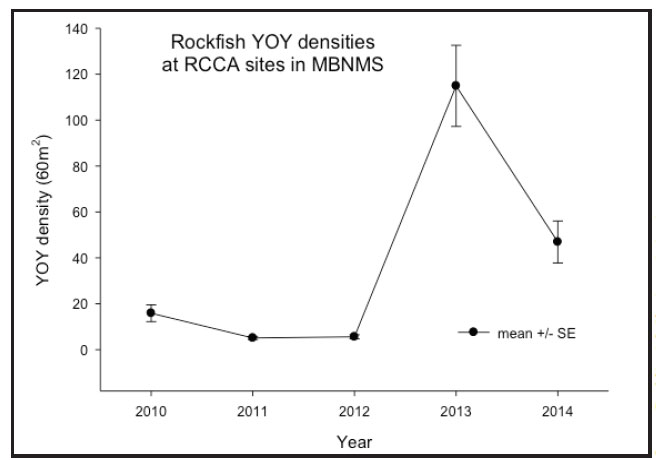
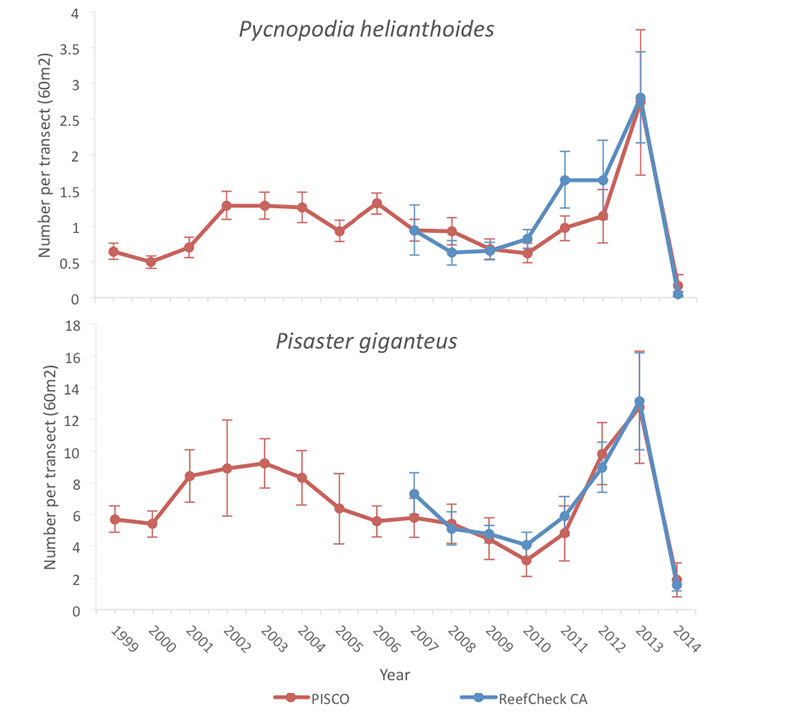
A major concern for the status of key species in both rocky intertidal and subtidal habitats is the drastic decline of sea star populations along the Northeast Pacific coast due to an extensive outbreak of sea star wasting syndrome. Similar die-offs have occurred in the past, but never before at this magnitude and over such a wide geographic area. Twenty affected species have been documented, including the ochre star (Pisaster ochraceus)(Figure 29), the giant star (Pisaster giganteus) and the sunflower star (Pycnopodia helianthoides) (Figure 30). Ochre and sunflower stars are considered to be keystone species in the nearshore environment because they have a disproportionately large influence on other species in their ecosystem. Declines in sea star populations in nearshore habitats may lead to changes in biodiversity at affected sites, for example through release of prey species that are commonly eaten by sea stars. However, it is too soon to understand the severity or persistence of any such changes. Substantial recruitment of baby sea stars has been observed in a few areas severely affected by wasting disease. This could indicate that replenishment of affected populations will be more rapid than expected; however, for recovery to occur, the new sea stars must be relatively unaffected by wasting disease and they must arrive at many of the locations that have been affected by wasting disease32. This is and will continue to be a topic of intense study along the West Coast and the ecological implications will be better understood in a few years.
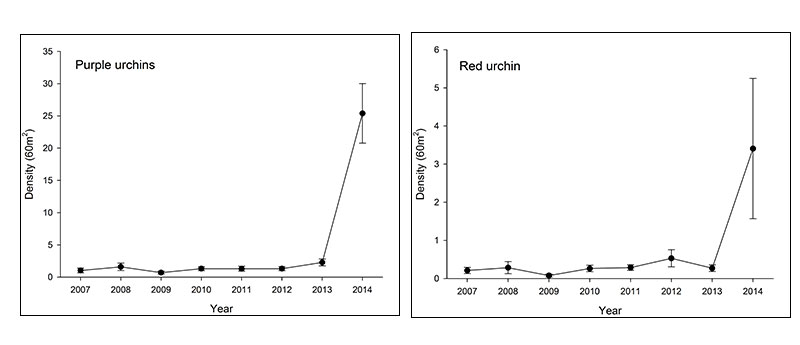
A second concern for the status of key species is the recent dramatic increase in the observed abundance of sea urchins in kelp forests. RCCA divers have observed a dramatic increase in the number of purple sea urchins (Strongylocentrotus purpuratus) and red sea urchins (Mesocentrotus franciscanus) that are visible during SCUBA surveys (Figure 31). It is unlikely that their abundance in the kelp forest system has increased this quickly, but instead that sea urchins have emerged from hiding in cracks and crevices in the reef now that one of their predators, the sunflower star, is absent or at very low abundance. Sea urchins consume canopy-forming kelp and understory algae and are capable of quickly removing most fleshy algal biomass from a site (Estes and Palmisano 1974). The ecological impacts of this recent change in sea urchin abundance and behavior could be substantial in kelp forest habitats, but will require more time and monitoring to understand.
Very little monitoring occurs for key species in beach and sandy seafloor habitats. The exception is the western snowy plover (Charadrius nivosus nivosus) for which monitoring is required due to its status as a threatened species under the Endangered Species Act. The estimated number of nesting birds observed each year from 2010 to 2014 ranged from 382 to 431, which significantly exceeded the target of 338 breeders recommended for the Monterey Bay area in the USFWS Recovery Plan (Page et al. 2015). While the number of nesting snowy plovers in the Monterey Bay area currently meets the USFWS Recovery Goal target, predator pressure is increasing in frequency and magnitude and continues to be one of the greatest management challenges. The status of snowy plovers in the Monterey Bay region is good but “management reliant” (C. Esyter, Point Blue Conservation Science, pers. comm.).
13. What is the condition or health of key species and how is it changing?
In 2009, the health of key species in the nearshore environment was rated "fair." The 2015 status will remain "fair" due to the health of some key species being negatively impacted by disease or contamination, which may cause measurable reductions in ecological function of those species. In 2009, the trend was rated "not changing" because the sanctuary’s impacted populations did not decline in number, but health appeared to be one reason they did not recover from depressed levels. The recent outbreak of a wasting syndrome resulted in significant population declines in many species of sea stars in both intertidal and subtidal habitats. Therefore, a new serious health issue for key species, wasting syndrome, downgraded the trend to "declining" in 2015.
Sea stars inhabiting the U.S. West Coast, both in rocky intertidal and subtidal habitats, started showing signs of wasting syndrome in mid-2013; by the end of 2014, an extensive outbreak had severely reduced sea star numbers at many sites up and down the coast (see Figures 29 and 30). Wasting syndrome has been documented in sea stars along the West Coast in the past, but this is the largest event ever observed. Wasting syndrome typically causes lesions to appear in the ectoderm, followed by decay of tissue surrounding the lesions, which leads to eventual fragmentation of the body and death. Scientists with the MARINe monitoring program documented 20 affected species including the giant star (Pisaster giganteus), the bat star (Patiria miniata) and the rainbow star (Orthasterias koehleri) (Figure 32). Hewson et al. (2014) provided evidence for a link between a densovirus and sea star wasting syndrome; however, there are likely to be additional contributing factors, such as warm water events.
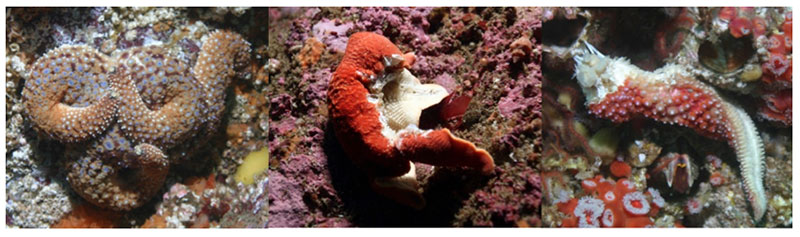
This densovirus is also found in other echinoderms (e.g., sea urchins). Scientist are closely monitoring sea urchin populations due to observations in 2014 of urchins with signs of wasting at some locations in southern California. However, wasting has been observed in sea urchins in the past and it is unclear whether these recent observations are due to a spread of the current outbreak to other echinoderm species or due to increased efforts to monitor and report any signs of wasting syndrome (S. Lonhart, MBNMS-SIMoN, pers. comm.).
In 2009, black abalone (Haliotis cracherodii) was listed as endangered under the Endangered Species Act (74 FR 1937). This species is ecologically extinct in the southern portion of the sanctuary (south of Point Sierra Nevada), where the population was reduced dramatically in the mid-2000s by withering syndrome (summarized in ONMS 2009); it has not shown any recent signs of recovery (P. Raimondi, PISCO/MARINe, pers. comm.). The disease has not caused populations north of Point Sierra Nevada to decline; however, the current reduced densities in this region hinder reproduction and population growth (P. Raimondi, PISCO/MARINe, pers. comm.).
Over the last six years, the number of stranded sea otters has increased, with the highest numbers ever observed in 2012 (both for the entire range and for the portion of the population in MBNMS). The leading causes of sea otter mortality is different for the sanctuary’s three regions. In the north coast region, there is high mortality from shark attacks, which is likely associated with the region’s close proximity to pinniped rookeries. In the central coast region, there is high mortality in breeding-age females likely due to food resource limitation because the population is likely at or near carrying capacity, the maximum population size that can be sustained by the resources available in the area. In the Monterey Bay region, disease and water quality issues impact sea otter health including high pollutant loads, protozoal infections (including Toxoplasma gondii and Sarcocystis neurona), bacterial infections, the microbial toxin microcystin and domoic acid intoxication from harmful algal blooms (Tinker et al. 2006, Miller et al. 2007, Miller et al. 2010, Tinker et al. 2013). Sea otters appear to be a very good indicator species for water quality issues (T. Tinker, USGS-WERC, pers. comm). For more details on water quality impacts to sea otters, see the response to Nearshore Question 2.
14. What are the levels of human activities that may influence living resource quality and how are they changing?
The status of human activities that may influence living resource quality in the nearshore environment remains “fair” with a “declining” trend. Consistent with our findings in 2009, a number of human activities have localized, negative impacts on living resources in the nearshore environment, and most of these activities are continuing at current levels or are increasing in intensity. Human activities, such as agriculture and urban development, can increase levels of contaminants in the nearshore environment and negatively impact the health of nearshore species, including mussels, some fish and sea otters, as was discussed in Nearshore Questions 2, 3 and 7.
Recent data on human activity levels along the coastline show that more people visit both beaches and the rocky shore (see Figure 19). Increased access and activity along the shore can increase damage from non-extractive activities, such as trampling, turning over rocks, flushing birds and marine mammals (Tenera Environmental 2003). In 2012, surveys of breeding pairs of black oystercatchers in Monterey County found that breeding success is reduced directly by humans and pinnipeds trampling nests, and indirectly by humans flushing adults, which leaves eggs and hatchlings vulnerable to predation from gulls.
The increased recreational use of beaches can have negative impacts on beach organisms as well. For example, kite flying, horseback riding and dogs off leash can disturb birds (as was noted for western snowy plovers in Nearshore Question 12), while picnicking can increase trash. Small pieces of trash in nearshore habitats may be ingested by foraging animals, or animals may become entangled in larger debris, such as lost fishing gear, ropes and packing straps (see response to Offshore Questions 8 and 14 for additional information). Litter clean-up activities on popular beaches and in rivers, as discussed in the response to Nearshore Question 8, helps to reduce the amount of debris that enters the nearshore environment.
Poaching (illegal harvest) continues to be a problem in MBNMS, both inside and outside of the marine protected areas (MPAs) implemented by California in state water in 2007 (north of Pigeon Point) and 2010 (South of Pigeon Point) (OST and CDFW 2013). While only a small number of people knowingly violate regulations, even a single poaching event can have a significant impact on a sensitive local population. For example, in 2009, wardens caught a poacher who took 60 black abalone from a central coast MPA (OST and CDFW 2013); this was a major impact to the endangered species at that site. Of the violations in central California MPAs (Figure 33), 94% occurred within 65 kilometers of Morro Bay, the base port for one of the large patrol vessels in the region, which suggests that an increased rate of patrol results in a higher detection of violations (OST and CDFW 2014). More funding and personnel are needed to increase enforcement and public education efforts. Additional restrictive measures on fishing in nearshore habitats, including seasonal closures, bag limits and area closures, may result in decreases in the overall fishing effort, but could also lead to redistribution of fishing effort and increased pressure in areas open to fishing. More monitoring of distribution and intensity of extractive human activities is needed to better understand the impacts of recent area closures.
A recent analysis of fishing effort in the sanctuary through 2012 looked at trends in shore fishing, private/rental boat and commercial passenger fishing vessels (CPFV) activities (Leeworthy and Schwarzmann 2015). Shore fishing in the sanctuary shows no obvious trend from 2004-2012, but there is more variability in recent years (2010 was lowest and 2011 was highest in the time series). Private/rental boat activity declined, then increased from 2005 through 2012, with the minimum number of person-days having occurred in 2008 and the highest number in 2012. The number of CPFV fishing person-days declined from 2004 through 2008, but from 2008 through 2012, the number of person-days increased. It is likely that the decline in private boat and CPFV fishing effort to a low in 2008 was strongly influenced by the absence of a salmon fishery due to low abundance of salmon in ocean waters (P. Reilly, CDFW, pers. comm.). However, the total number of person-days in 2012 was roughly two-thirds of the level in 2004. Overall, fishing effort appears to have remained the same or slightly increased since the 2009 report.
Organisms living in sandy beach and subtidal habitats are impacted by several types of human activities. These include coastal armoring to reduce bluff erosion and protect buildings, coastal development, grooming of the sand at popular beaches, sand mining (in the city of Marina), disposal of harbor dredge spoils, and the placement of outfalls from storm drains, sewage treatment facilities, desalination plants and power plants. Most of these activities are at levels similar to those reported in the 2009 Condition Report; however, given the extreme drought facing California (see Droughts in California text box), it is likely that desalination activity will increase in the next few years.
Nearshore Environment Living Resources Status and Trends
Status: Good Good/Fair Fair Fair/Poor Poor Undet.
Trends:
▲ Conditions appear to be improving.
- Conditions do not appear to be changing.
▼ Conditions appear to be declining.
? Undeterminted trend.
N/A Question not applicable.
| # | Issue | Rating | Confidence | Basis For Judgement | Description of Findings |
|---|---|---|---|---|---|
| 9. | Biodiversity |
|
Status: Very High Trend: Very High |
Fishing, collecting and poaching have altered biodiversity from what would be expected in a natural state. Most assemblages appear to be fairly stable except for sea stars and urchins. | Selected biodiversity loss may inhibit full community development and function and may cause measurable, but not severe degradation of ecosystem integrity. |
| 11. | Non-Indigenous Species | Status: Very High Trend: Very High |
A few non-indigenous species have been identified, and some appear to be spreading. | Non-indigenous species are not suspected or do not appear to affect ecosystem integrity (full community development and function). | |
| 12. | Key Species Status | Status: Very High Trend: Very High |
Abundance of some key species in each habitat type is lower than would be expected in a natural state. Many key species stable or slowly increasing, but recent dramatic declines for many sea star species. | The reduced abundance of selected keystone species may inhibit full community development and function, and may cause measurable but not severe degradation of ecosystem integrity; or selected key species are at reduced levels, but recovery is possible. | |
| 13. | Key Species Condition | Status: Very High Trend: Very High |
Continuing health problems in sea otters and black abalone. New severe health issue for sea stars. | The diminished condition of selected key resources may cause a measurable, but not severe reduction in ecological function, but recovery is possible. | |
| 14. | Human Activities | Status: Very High Trend: Very High |
Variety of visitation, extraction and coastal development activities, some of which are increasing in frequency. | Selected activities have resulted in measurable, living resource impacts, but evidence suggests effects are localized, not widespread. |
The questions with red numbers have new ratings compared to the 2009 Monterey Bay National Marine Sanctuary Condition Report (ONMS 2009).
Nearshore Environment: Maritime Archaeological Resources
The following information provides an assessment of the current status and trends of the maritime archaeological resources in the nearshore environment.
15. What is the integrity of known maritime archaeological resources and how is it changing?
The integrity of the known maritime archaeological resources in nearshore habitats was rated “fair” with an “undetermined” trend in the 2009 Condition Report (ONMS 2009). This status assessment was based on limited information because only one nearshore archaeological site location inventory has been conducted in MBNMS’s nearshore environment (In 1979-1981, the National Park Service inventoried the California Gold Rush passenger steamship Tennessee lost in 1853) (Schwemmer 2006a). However, anecdotal information indicated that recreational divers and beachcombers had removed artifacts from shipwrecks, and that sites were reported in various stages of degradation due to their exposure to waves, shifting sands and strong currents.
In 2015, there is no new information on the integrity of known maritime archaeological resources in the nearshore environment; therefore, this question continues to be rated “fair.” There is no baseline monitoring information available to detect a change or impact to the resources; hence, the trend in their integrity remains “undetermined.” It is assumed that less relic hunting occurs today due to education, and the fact that most of the accessible sites have already been pilfered; yet, some of the less impacted sites are becoming well known due to an increase in the information exchanged among enthusiasts.
16. Do known maritime archaeological resources pose an environmental hazard and is this threat changing?
In 2009, this question was rated “good” and the trend was “not changing” because the known maritime archaeological resources in the nearshore environment were believed to pose few or no environmental threats. Monterey Bay National Marine Sanctuary’s inventory of known maritime archaeological resources in shallow water (50 feet or 15 meters, or less) suggested an unlikelihood that the remains of shipwrecks inside the sanctuary boundary hold hazardous cargos and/or bunker fuels; this was also true for most shipwrecks located near the entrance to San Francisco Bay (just beyond the sanctuary boundary).
New information gathered since 2009 indicates that at least one nearshore shipwreck located just outside the sanctuary boundary, the freighter Fernstream lost in 1952 (Figure 34; Vessel 2 on Figure 35), has the potential to pose an environmental hazard to sanctuary resources. Specifically, the ship’s deterioration could result in the release of hazardous cargo and/or bunker fuel that prevailing currents have a high likelihood of carrying from this source into MBNMS. Due to the fact that the Fernstream is the highest ranked potentially polluting wreck that occurs in U.S. Coast Guard District 11, and the structural integrity of the vessel is reduced, this question is now rated “fair” with a “declining” trend.
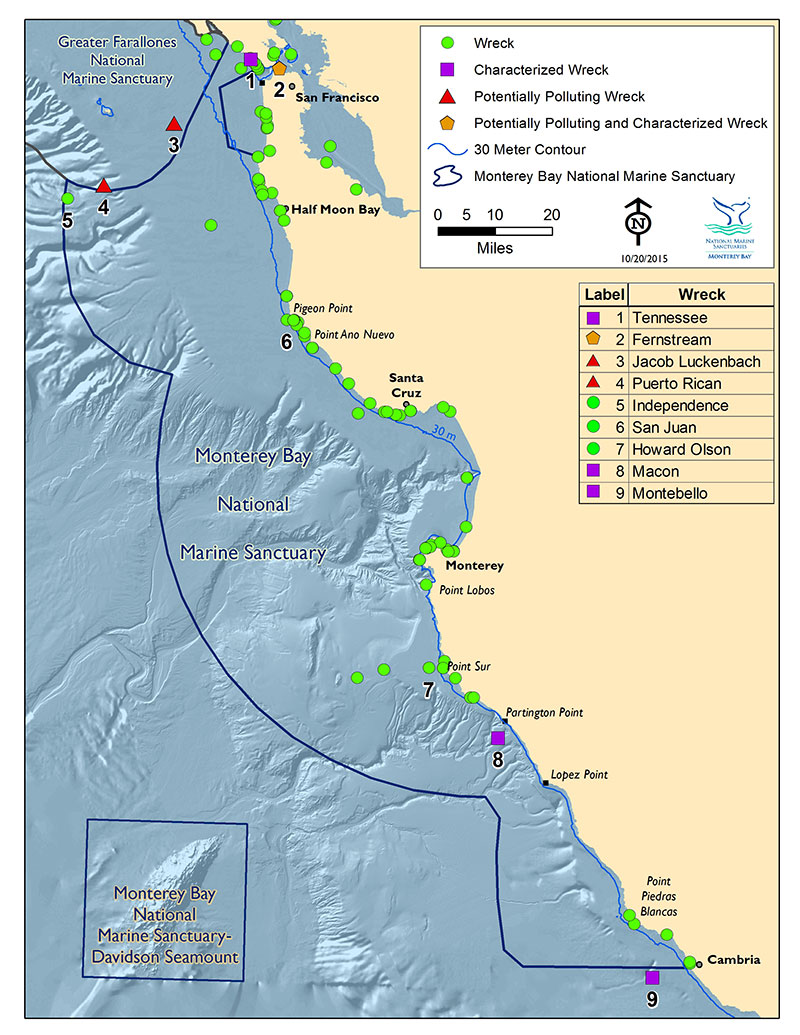
In 2013, NOAA completed a risk assessment of the Fernstream (NOAA 2013b), and followed with three surveys which allowed for a more detailed assessment of the wreck (NOAA 2014). The Fernstream is the highest ranked potentially polluting wreck in U.S. Coast Guard District 11, which includes the coastal and offshore waters off California to South America (NOAA 2013b). For the worst case discharge scenario, the Fernstream scored high; for the most probable discharge scenario, the Fernstream scored medium (NOAA 2013b). Surveys in 2013 suggest the structural integrity of the vessel is reduced (Figure 36) and the vessel most likely contains some diesel bunker fuel and oil lubricants, although it is likely trapped beneath sediments (NOAA 2014). Under the National Contingency Plan, the U.S. Coast Guard and the regional response team have the primary authority and responsibility to plan, prepare for and respond to oil spills in U.S. waters. NOAA recommended that this site be included within the Area Contingency Plan, and active monitoring programs should be implemented, based on the results of the three surveys of opportunity in 2013. Outreach efforts with the technical and recreational dive community, as well as commercial and recreational fishermen who frequent the area, would be helpful to gain awareness of changes at the site. The final determination of what type of action, if any, rests with the U.S. Coast Guard.
17. What are the levels of human activities that may influence maritime archaeological resource quality and how are they changing?
Several human activities that occur in the sanctuary may influence the quality of maritime archaeological resources in the nearshore environment, including the removal of artifacts from archaeological sites, diving, anchoring and fishing activities (e.g., historic trawling, other gear impacts). For the known archaeological sites in the nearshore environment, human activities did not appear to have a significant negative impact on the integrity of these resources so this question was rated “good/fair” in the 2009 Condition Report (ONMS 2009). Given that these potential impacts had not been measured, the trend in 2009 was “undetermined.” There is no new information available on the levels of human activities that influence maritime archaeological resources; therefore, the 2015 ratings remain “good/fair” with an “undetermined” trend.
Nearshore Environment Maritime Archaeological Resources Status and Trends
Status: Good Good/Fair Fair Fair/Poor Poor Undet.
Trends:
▲ Conditions appear to be improving.
- Conditions do not appear to be changing.
▼ Conditions appear to be declining.
? Undeterminted trend.
N/A Question not applicable.
| # | Issue | Rating | Confidence | Basis For Judgement | Description of Findings |
|---|---|---|---|---|---|
| 15. | Integrity | Status: N/A (not updated) Status: N/A (not updated) |
Divers have looted sites, but few sites have been studied to determine trend. | The diminished condition of selected archaeological resources has reduced, to some extent, their historical, scientific or educational value and may affect the eligibility of some sites for listing in the National Register of Historic Places. | |
| 16. | Threat to Environment | Status: Medium Status: Medium |
Known resources containing hazardous material continue to deteriorate. | Selected maritime archaeological resources may cause measurable, but not severe, impacts to certain sanctuary resources or areas, but recovery is possible. | |
| 17. | Human Activities | Status: N/A (not updated) Status: N/A (not updated) |
Activities, such as recreational, diving occurs on wreck sites, but activity level is unknown. | Some potentially relevant activities exist, but they do not appear to have had a negative effect on maritime archaeological resource integrity. |